9
CHAPTER
2
Burner description
2.6
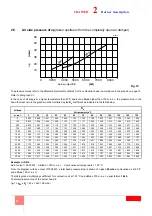
Gas side pressure drop
mbar
KW
0 1000 2000 4000 6000 8000
4
G2
0
G2
5
6
8
10
12
14
16
2
18
20
D7541
D8328
50
40
30
20
10
mbar
KW
DB4
DB
6
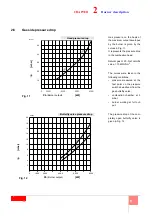
Gas pressure on the basis of
the maximum output developed
by the burner is given by the
curves in Fig. 11.
It represents the pressure drop
in the combustion head.
Natural gas G 20 - Net calorific
value = 10 kWh/Nm
3
The curves were taken in the
following conditions:
•
pressure measured at the
test point on the pressure
switch downstream from the
gas butterfly valve;
•
combustion chamber at 0
mbar;
•
burner working at full out-
put.
The pressure drop of the com-
pletely open butterfly valve is
given in Fig. 12.
Butterfly valve pressure drop
Pb
(Burner output)
[kW]
Fig. 11
Head pressure drop
p
[mbar]
Pb
(Burner output)
[kW]
Fig. 12
p
[mbar]
Summary of Contents for DB 6 SM CO1 A0
Page 2: ......
Page 43: ...1...
Page 44: ...2 1 3 3 3 2 4 4 4 5 6 8 9 3 10 10 10 10 10 4 11 11 12 5 13 13 14 15 15 17 18 18 6 19 19...
Page 47: ...5 2 2 3 1 2 3 4 5 6 7 8 9 10 11 UV 12 13 14 15 16 17 18 19 20 21 M12x16 2 20076243...
Page 49: ...7 2 DN 80 160 18 4 54 5 4 9 5 3 8 0 M18 D8325 7 8 D3974 9 D7549 DB6 SM...
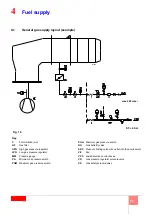
Page 53: ...11 4 4 1 D7543 C GF HPG LPG MM PA PGM PGm RG SRV VE VPS VR VS 0 5 4 bar 500 mbar 16...
Page 54: ...12 4 4 2 MB PA PGM SM UV UV TA TB D9854 17...
Page 56: ...14 5 5 2 20 20 20076847...
Page 57: ...15 5 5 3 1 4 2 3 5 6 7 1 2 0 3 20 4 5 20 130 1 4 5 4 130 22 21 D1500 3 2 4 1 22 1 2 3 4 D1499...
Page 58: ...16 5 MAN 3 1 130 90 2 22 2 22 20 2 2...
Page 60: ...18 5 5 7 70 A 187 V 100 A c c 100 F 1V c c 5 8 1 2 3 4 5 1 2 3 4 5 6 D1143 26...
Page 61: ...19 6 6 1 1 2 3 VR VR VS VR...
Page 62: ...20 6...
Page 63: ......

