Operation
PT12
Manual
7/20/2021
Page
14
of
48
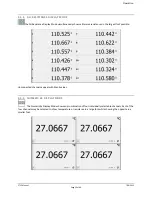
All
Resistances
:
Shows
a
2x6
grid
with
the
resistances
of
all
twelve
probes.
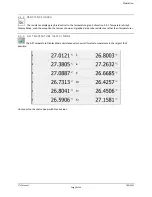
4x
Numeric
:
Shows
a
2x2
grid
with
the
temperatures
and
resistances
of
any
four
selected
probes.
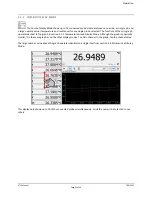
2x
Numeric
:
Shows
temperatures
and
resistances
in
a
large
font
for
any
two
selected
probes.
Combo
:
Shows
up
to
twelve
connected
probe
temperatures
on
one
side,
a
mini
graph,
and
a
large
numeric
value
(temperature
and
resistance)
for
any
single
probe
selected.
Probe
Status
:
Shows
the
probe
connection
status
of
each
channel
of
the
PT12.
4.3.1
TEMPERATURE
GRAPH
DISPLAY
MODE
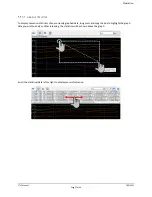
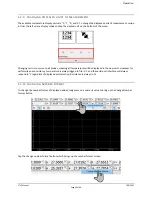
To
add
a
probe
to
the
graph,
tap
on
its
numeric
value.
The
numeric
value
will
be
outlined
in
a
unique
color,
and
the
temperature
plot
will
appear
on
the
graph
in
that
same
color.
NOTE:
The
graph
only
retains
the
last
48
hours’
worth
of
data,
while
the
log
holds
all
the
data
since
the
last
power
cycle
or
when
logging
was
last
toggled
on.


