Starting
Up
the
PT12
PT12
Manual
7/20/2021
Page
9
of
48
3.2
PLOTTING
TEMPERATURE
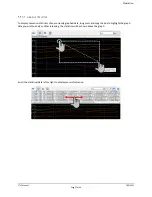
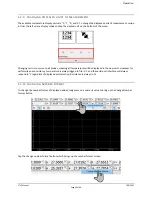
To
add
a
probe’s
value
to
the
graph,
tap
the
appropriate
probe
(probe
5
in
this
case)
on
the
top
portion
of
the
screen.
The
probe’s
recent
data
will
be
plotted
on
the
graph.
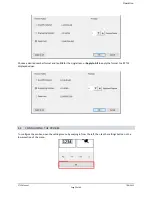
To
ensure
that
the
data
is
visible,
tap
the
Show
All
graph
buttons,
and
the
Continuous
Update
button
to
enable
them.
When
enabled,
they
are
highlighted
in
light
blue.
Drag
a
single
finger
on
the
graph
to
scroll
in
any
direction.
Use
two
fingers
for
pinch
‐
zoom
operation.
For
additional
information
on
graph
functions,
see
section
4.3.1
Temperature
Graph
Display
Mode
Note:
The
graph
only
retains
the
last
48
hours
of
data,
while
the
log
file
holds
all
the
data
since
the
last
power
cycle
or
when
logging
was
last
toggled
on.
See
sections
4.5
File
Manager
and
4.6
System
Info.


