Operation
PT12
Manual
7/20/2021
Page
16
of
48
ZOOMING
THE
GRAPH
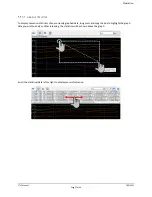
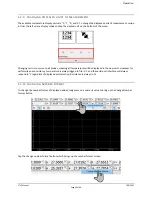
Pinch
in/out
with
two
fingers
to
zoom
the
graph
in/out.
Alternatively,
to
zoom
a
single
axis,
long
press
on
the
axis
area
then
drag.
For
y
‐
axis,
drag
up
or
down
to
zoom
in
or
out.
For
x
‐
axis,
drag
right
or
left
to
zoom
in
or
out.
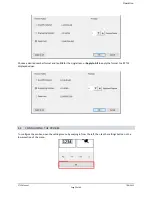
AXIS
CONTROL
Show
All
(x
‐
axis):
While
the
button
is
selected
the
x
‐
axis
will
be
scaled
to
show
all
data.
Show
All
(y
‐
axis):
While
the
button
is
selected
the
y
‐
axis
will
be
scaled
to
show
all
data.
Fixed
y
‐
axis
(semi
‐
auto):
While
the
button
is
selected
the
y
‐
axis
is
fixed.
If
the
data
goes
out
of
bounds
the
y
‐
axis
automatically
adjusts
to
fit
the
data.
Locked
y
‐
axis:
While
the
button
is
selected
the
y
‐
axis
remains
exactly
as
shown
without
any
auto
adjustment.
X
‐
axis
Width:
Fixes
the
width
of
the
x
‐
axis
to
the
specified
period
of
time.
Scrolling
does
not
affect
this
value
however,
zooming
overrides
this
value.
The
numeric
value
displays
in
hours,
minutes,
or
seconds
based
on
its
associated
drop
‐
down
menu.
Continuous
Update:
While
the
button
is
selected,
the
graph
will
always
display
the
most
recent
values,
scrolling
the
time
axis
as
required.
Manually
scrolling
or
zooming
will
disable
this
button.


