


Trying out the instrument
R&S
®
RTE
64
Getting Started 1326.1026.02 ─ 10
6.6.4
Displaying a histogram
Histograms are useful to analyze the occurrence of measurement values statisti-
cally.
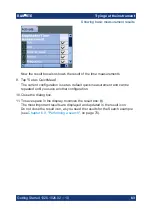
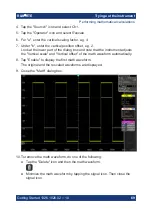
1. Tap the "Histogram" icon on the toolbar.
2. Tap the diagram in which you want to generate the histogram.
You can also draw a rectangle on the screen to define the area on which the
histogram is based. The histogram range is indicated in the diagram and a
vertical histogram is defined and displayed.
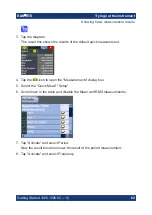
Showing basic measurement results


