


Operating the instrument
R&S
®
RTE
103
Getting Started 1326.1026.02 ─ 10
●
In a docked tab below the diagram (available only for automatic and cursor
measurements)
The default position and the font size can be adjusted.
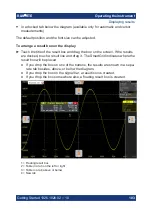
To arrange a result box on the display
► Touch the title of the result box and drag the box on the screen. If the results
are docked, touch a result line and drag it. The SmartGrid indicates where the
result box will be placed.
● If you drop the box on one of the buttons, the results are shown in a sepa-
rate tab besides, above, or below the diagram.
● If you drop the box on the signal bar, a result icon is created.
● If you drop the box somewhere else, a floating result box is created.
1 = Floating result box
2 = Table in a tab on the left or right
3 = Table in a tab above or below
4 = New tab
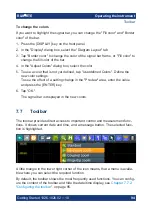
Displaying results


