Common Analysis and Display Functions
R&S
®
FSVA3000/ R&S
®
FSV3000
445
User Manual 1178.8520.02 ─ 01
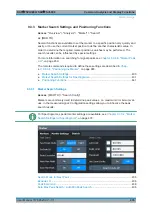
9.3.4.2
Measuring Noise Density (Noise Meas Marker)
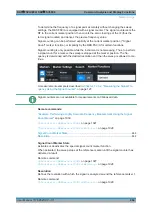
Access
: "Overview" > "Analysis" > "Marker Functions" > "Select Marker Function" >
"Noise Measurement" > "Noise Meas Config"
Or
: [MKR FUNC] > "Select Marker Function" > "Noise Measurement" > "Noise Meas
Config"
Using the noise measurement marker function, the noise power density is measured at
the position of the marker. In the time domain mode, all points of the trace are used to
determine the noise power density. When measurements are performed in the fre-
quency domain, eight points to the right and left of the marker (if available) are used for
the measurement to obtain a stable result.
Result display
Noise density is the noise referred to a bandwidth of 1
Hz. With logarithmic amplitude
units (dBm, dBmV, dBmµV, dBµA), the noise power density is output in dBm/Hz, i.e. as
the level in 1
Hz bandwidth with reference to 1
mW. With linear amplitude units (V, A,
W), the noise voltage density is analyzed in µV/
√
Hz; the noise current density in µA/
√
Hz; the noise power density in µW/
√
Hz.
The result is indicated as the
function result in the Marker Table
.
Prerequisite settings
The following settings are required to obtain correct values:
●
Detector: Sample or RMS
●
Video bandwidth:
≤ 0.1 resolution bandwidth with sample detector
≥ 3 x resolution bandwidth with RMS detector
●
Trace averaging:
In the default setting, the R&S
FSV/A uses the sample detector for the noise func-
tion. With the sample detector, you can set the trace to "Average" mode to stabilize
the measured values. When the RMS detector is used, trace averaging produces
noise levels that are too low and cannot be corrected. Instead, increase the sweep
time to obtain stable measurement results.
Correction factors
The R&S
FSV/A uses the following correction factors to analyze the noise density from
the marker level:
●
Since the noise power is indicated with reference to 1
Hz bandwidth, the bandwidth
correction value is deducted from the marker level. It is 10
x
lg (1
Hz/BWNoise),
where BWNoise is the noise or power bandwidth of the set resolution filter (RBW).
●
RMS detector: With the exception of bandwidth correction, no further corrections
are required since this detector already indicates the power for each point of the
trace.
●
Sample detector: As a result of video filter averaging and trace averaging, 1.05
dB
is added to the marker level. This is the difference between the average value and
Marker Usage

