31
Step 4:
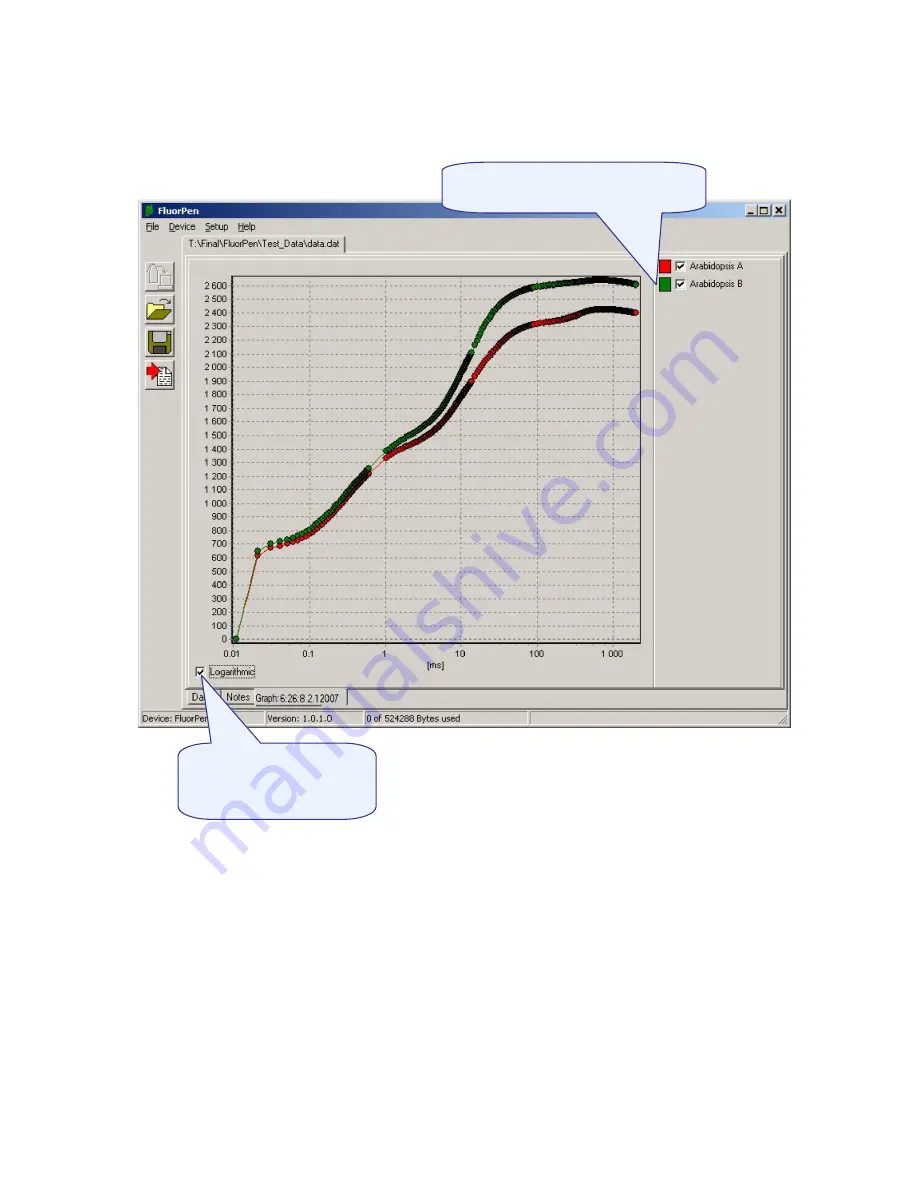
To visualize measurement in the graphic mode, click the “Graph” field in the bottom bar.
Step 5:
The colored Graph of measured data appears.
Step 6:
For
export
press File>Export or “Export” icon, select what you want to export (Ft, QY, Measuring
by protocol…). Measuring by protocol export all protocols at once (OJIP, NPQ, LC...).
Selected only
- exports only one measurement that is selected by mouse, otherwise it will export
everything.
Source data
- exports raw data, in case of OJIP: points of the curve
Computed values
- export calculated data, in case of OJIP: Fo, Fi, Fj...
Description
- exports the data description if any
Selection of data corresponds to
their description
Choose logarithmic or
non-logarithmic graph
form
Summary of Contents for FluorPen FP 100
Page 13: ...13...
Page 14: ...14...
Page 15: ...15...
Page 16: ...16...
Page 17: ...17...
Page 18: ...18...
Page 19: ...19...
Page 32: ...32...
Page 34: ...34 Example of OJIP protocol...
Page 36: ...36...
Page 37: ...37 Example of NPQ1 protocol Example of NPQ2 protocol...
Page 39: ...39...
Page 40: ...40...
Page 41: ...41 Example of LC1 protocol Example of LC2 protocol...
Page 42: ...42 Example of LC3 protocol...


