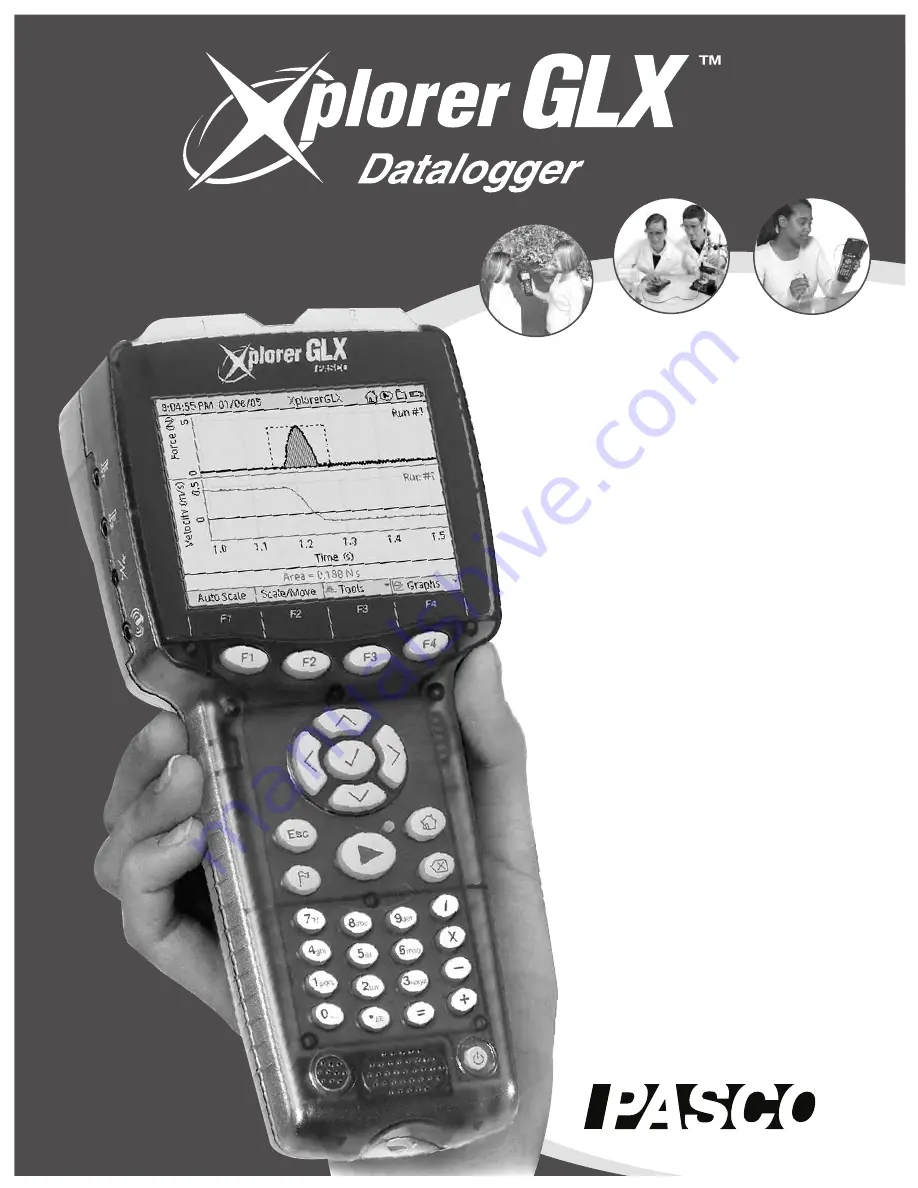
background image

0 12 - 0 89 5 0 F

Users’ Guide

• Using the Xplorer GLX 

Standalone

• Using the Xplorer GLX 

with a Computer

• Sample Activities

New Features:

File storage on USB flash drive, p. 83

Update firmware from flash drive, p. 93

Instant data monitoring in Digits and 
Meter displays, pp. 37 & 38

Voice and Text Data Annotation, p. 25

(more on page ii)

Summary of Contents for Xplorer GLX

Page 1: ...sing the Xplorer GLX with a Computer Sample Activities New Features File storage on USB flash drive p 83 Update firmware from flash drive p 93 Instant data monitoring in Digits and Meter displays pp 3...

Page 2: ...GLX data transfer p 84 New for Version 1 1x Scope Mode p 22 Output control Calculations p 50 Built in Sound Sensor p 58 Data Collection with ScienceWorkshop Sensors pp 59 67 Address PASCO scientific 1...

Page 3: ...our data files transfer them to the GLX s internal Flash memory a USB Flash drive or a computer See pages 78 84 and 100 of the Users Guide for more information Fully Charge the Battery Put the GLX awa...

Page 4: ......

Page 5: ...Notation 91 Printing 91 Chapter 5 Hardware Maintenance and Operation Firmware Update 93 Battery and Power 93 Resetting 96 Operating Temperature 97 Chapter 6 Using the Xplorer GLX with a Computer GLX...

Page 6: ......

Page 7: ...Part 1 Users Guide...

Page 8: ......

Page 9: ...robe con nected directly to specialized ports An optional mouse keyboard or printer can be connected to the Xplorer GLX s USB ports The Xplorer GLX contains an integrated speaker for sound generation...

Page 10: ...C A D E F G H A GLX Users Guide B Xplorer GLX C AC Power Adapter D Registration Card E Getting Started with the Xplorer GLX CD ROM F Two Fast response Temperature Probes 10 to 70 C G Voltage Probe 10...

Page 11: ...battery to fully charge If the battery has already been charged you can use the GLX without the AC adapter To turn it on using battery power push the power button at the lower right corner of the keyp...

Page 12: ...been set to Open Last Experiment it will automatically open the most recently saved file See page 86 for more information Back Light To turn on the screen s back light press and hold while you press...

Page 13: ...Cable Signal Output If you have headphones or a pair of amplified stereo speakers that you wish to use for sound generation connect them to the signal output port You also have the option of using the...

Page 14: ...t the Startup Action of the GLX to Open Last Experiment the file will automatically open when you turn on the GLX See page 86 for more information Sleep Between Samples If the GLX is running on batter...

Page 15: ...n lead to the other screens of the GLX envi ronment To open another screen via one of the main icons use the up down left and right arrow keys to highlight the desired icon then press The highlight wr...

Page 16: ...guration or collected data See page 53 for more information Graph Use the Graph to plot and analyze data In many cases the Graph is the best way to view data as they are being collected See page 13 fo...

Page 17: ...op data collection Memory Gauge The Memory Gauge indicates the GLX s available memory As data are stored in random access memory RAM the icon becomes shaded from the bottom up An entirely shaded icon...

Page 18: ...12 O v e r v i e w o f t h e G L X...

Page 19: ...ts or manually entered data Graph The Graph plots data on a pair of axes Use the Graph to view compare and ana lyze data sets To Open the Graph From the Home Screen do one of the following press the f...

Page 20: ...the up and down keys to highlight the desired menu option then press or press the number on the keypad corresponding to the desired menu option To turn off the highlight without selecting one of the...

Page 21: ...ions on displaying two vertical data sources simultaneously If you do not see the sensor measurement that you want in the data source menu select More to expand the menu For more information on select...

Page 22: ...ove the Data Cursor the left and right arrow keys step the Data Cursor to adja cent data points the up and down arrow keys make the cursor jump to the first and last visible data points Press and hold...

Page 23: ...drag on or between the numeric labels on the edges of the Graph to change the vertical and horizontal ranges To move the plot up down left and right click and drag anywhere in the back ground of the G...

Page 24: ...arrow a few times to separate them The left and right arrow keys move the triangle to adjacent data points the up and down arrow keys send the triangle to the first and last visible data points Press...

Page 25: ...rest ROI which is indicated by a dashed box Statistics mode Two cursors designate the left and right sides of the ROI The larger cursor is the active one and can be moved with the arrow keys or mouse...

Page 26: ...recording after you press until a certain condition is met by the incoming data The Trigger has two parameters Trigger Edge which can be rising or falling and Trigger Level which specifies the data v...

Page 27: ...ger Settings dialog box press to accept the changes or press to cancel them Zoom Use the Zoom Tool to enlarge an area that you define by drawing a rect angle Select Zoom from the Tools menu a zoom cur...

Page 28: ...onnected lines left and without connected lines right Scope Mode Select Scope mode from the Graphs menu to make the GLX emu late a digital storage oscilloscope In this mode the GLX collects and displa...

Page 29: ...isplayed in the upper right corner To change the run number of either measurement select the corresponding run number field 11 One of the measurements is plotted in black and the other one in gray The...

Page 30: ...asurement is plotted on the top or bottom half of the screen rather than overlapping One of the measurements is plotted in black and the other one in gray The mea surement in black is the active data...

Page 31: ...int in the Graph display Press quickly to mark a data point with an icon representing an empty note You can later add text and audio to this note Press and hold and begin speaking to mark a point and...

Page 32: ...he note To switch Always Show Text on or off select it from the Annotation Menu Delete Note Select this option to delete the entire note including the text and audio portions and the flag icon Move Se...

Page 33: ...ing 14 When you record new audio the note s previous audio is overwritten To play the audio portion of the note select Play Audio Note from the Audio Note menu 16 To delete the audio select Delete Aud...

Page 34: ...ta appear in each column See page 14 for more information about active fields Data Source Select the data source field21 at the top of a column to choose a sensor measurement calculation manually ente...

Page 35: ...s in the run number menu are Delete Run and Rename Run See Run Number on page 15 for more information Table Scrolling At any time up to eight cells of data are visible in each column Press the up or d...

Page 36: ...shed Navigating Box is visible23 see page 34 When you select Delete Cell the cell that the Navigating Box is on is deleted Every cell below the deleted cell shifts up by one position Num Lock Num Lock...

Page 37: ...is option select it from the Tables menu With the option turned on times displayed in the Table appear as the date and time of day at which each data point was recorded With the Date Time option turne...

Page 38: ...screen plus as much additional data as will fit on one page 30 Print All Select Print All to print the entire contents of the displayed data sets including data that are not currently visible on the s...

Page 39: ...e non numeric text string can contain numerals but it must have at least one letter or punctuation mark so the GLX knows that it is supposed to be text This limitation applies to only one cell in the...

Page 40: ...ss the entire contents of the cell will be deleted If the cell contents are not highlighted they will be amended at the location of the blinking cursor If you press the character to the left of the cu...

Page 41: ...shed Navigating Box must be visible 34 To scroll up press the up arrow key repeatedly or press and hold it to move the Navigating Box to the first visible cell then continue to press or hold the key T...

Page 42: ...vertical data source menu see page 15 Text Data A text data set can be displayed on the horizontal axis of the Graph First select a numeric data as the vertical data source then select the text data...

Page 43: ...information on selecting data from a data source menu see Data Source Menus on page 89 Also select the data source field to access the Data Properties of the displayed data See Data Properties on page...

Page 44: ...t data point For more information on selecting data from the a data source menu see Data Source Menus on page 89 Units Select the units field36 at the top of the display to select different units for...

Page 45: ...ghlight Press to select the highlighted control If a menu opens use the up and down arrow keys to highlight the desired setting and press If a cursor appears type the desired value and press The Volum...

Page 46: ...uration the Left Output Channel plays through the left speaker or the left side of the headphones and the Right Output Channel plays through the right speaker or the right side of the headphones 2 Lef...

Page 47: ...sic algebraic graphing and sensor based The following examples will demonstrate the four types Basic Calculations Basic calculations involve only numerals no constants or variables Open the Calculator...

Page 48: ...bol it will prompt you to enter it If you are entering an equation to be graphed leave one symbol undefined See Graphing Equations on page 44 for more information Try these examples Type a 3 For the a...

Page 49: ...of b at the bottom of the screen and fills in the result of b 3 on the line above Rather than a simple expression you can enter a complete equation for the Calculator to evaluate Enter 6 z y 2 When p...

Page 50: ...the screen The preview graph will always show the equation that the cursor is on Move the cursor down to m and see what happens Press again to turn off the preview graph The preview graph is a simpli...

Page 51: ...the left of the equal sign is the name of that calculation and will appear as the vertical axis label on the Graph It can consist of any combination of letters numerals and spaces If you are defining...

Page 52: ...where the difference between the measured temperature and room temperature is of interest a study of Newton s law of cooling for instance The calculation in the example shifts the temperature graph d...

Page 53: ...nsors a calculation can be used to compare the separate measurements For example if you are using two temperature probes named Temperature and Temperature2 and you want to know the temperature differe...

Page 54: ...the capacitance and R is the resistance through which the capacitor discharges Calculator Function Keys F1 Functions Press or click Functions repeatedly to access the three Functions menus These menus...

Page 55: ...ed constant The Calculator will recognize its value as 3 141592 when it is used as part of an expression or on the right side of an equation The symbol e is a predefined constant equal to 2 718282 The...

Page 56: ...Expression This option removes the expression that the cursor is on and leaves a blank line Delete Expression This option removes the expression that the cursor is on and shifts up everything below i...

Page 57: ...t is not specified in the Calculator will be determined by the setting in the Output screen see page 39 In the Functions menu the names of these functions are abbreviated to outstate outswitch outfreq...

Page 58: ...ents the first two min and max define the upper and lower limit of a range and the third x is an input value to be compared with that range If min x max then the function equals 1 If x min or x max th...

Page 59: ...store multiple notes pages To start a new page press to open the Notes menu and select New Page 19 If more than one page exists you can also press to select a previously cre ated page for viewing and...

Page 60: ...w keys to highlight the Stopwatch icon then press or click the Stopwatch icon Timing with the Stopwatch The numbers displayed on the stopwatch indicate elapsed time in minutes and seconds Press to sta...

Page 61: ...ighlight the Sensors icon and press or click the Sensors icon From anywhere in the GLX environment you can always open the Sensors Screen with the shortcut Working with Multiple Sensors An icon for ea...

Page 62: ...arrow keys to highlight Sam ple Rate Unit 2 Press to open the menu 3 Use the arrow keys to highlight the desired units and press or press the number on the keypad corre sponding to the desired units...

Page 63: ...mpling mode6 that mode is applied to all sensors Continuous Sampling Continuous Sampling is the default and most com monly used mode In this mode when you press the GLX starts to collect and record da...

Page 64: ...When Sound Level is selected the GLX s microphone measures the loudness of sound in decibels on the dBA scale The Sound Level sensor operates at a much lower sampling rate than the Sound Sensor Like m...

Page 65: ...pecial menu listing all ScienceWorkshop sensors appears From this menu select the sensor that you have connected or will connect to the adapter 11 After you have selected it the sensor appears in the...

Page 66: ...with a Graph dis play automatically set up to display a sensor measurement on the verti cal axis and manually entered data on the horizontal axis Sampling 1 Press The GLX starts measuring but not reco...

Page 67: ...record a sample You then realize that you made a mistake you forgot to wait for the measurement to sta bilize To correct the mistake press the up arrow to return the flag icon to the first row Press...

Page 68: ...ather than collecting data at a constant rate they send a signal to the GLX only when an event happens For instance when a photogate switches from being blocked to unblocked or vice versa when the spo...

Page 69: ...single photogate to the GLX If the Timing Screen does not open automatically go to the Home Screen use the arrow keys to highlight the Timing icon and press Then press to open the Add menu 2 You will...

Page 70: ...launches automatically when you connect a photogate or other timing sensor If you wish to set up a timer for a sensor that you have not yet connected or for a sensor that is already connected open the...

Page 71: ...Spoke Angle Spacing Angular Velocity and angular Acceleration are calculated based on the time intervals between the changes in angle Free Fall Adapter Use this timer with PASCO part ME 9207B The con...

Page 72: ...ates is blocked except the first time Velocity Between Gates equals Photogate Spacing divided by Time Between Gates General Counting Use this timer with nuclear sensors drop counters and other countin...

Page 73: ...er part of the screen then press or If there are data collected by that timer they will be permanently deleted The GLX will ask you for confirmation before it deletes the timer Digital Adapter Options...

Page 74: ...ately so you can connect a second relay to the adapter with no additional set up required You can connect up to four Digital Adapters each with two ports for up to eight separately controlled output c...

Page 75: ...measurement change Temperature to Water Temperature for instance or to shorten it change Force to F for instance To edit the Measurement Name use the up and down arrows keys to highlight it and press...

Page 76: ...Notation This style is similar to scientific notation but there are three digits to the left of the decimal place and Number of Digits deter mines the number of digits to the right of the decimal plac...

Page 77: ...dialog box will not open during data collection Theory of Calibration To skip to the practical instructions on calibrating a sensor see Navigating in the Calibration Dialog Box on page 73 and Calibra...

Page 78: ...int In a two point calibration you reset two points to define a new line This type of calibration affects both the slope and the offset For step by step instructions on the two point calibration proce...

Page 79: ...by step instructions Navigating in the Calibration Dialog Box For step by step instructions on the calibration procedure see page 75 The Calibration dialog box contains a list of fields that are used...

Page 80: ...1 Point Slope and 1 Point Offset Pt 1 Standard Value Highlight this field and press Enter a value and press Pt 1 Sensor Input Value It is usually not necessary to access this field because its value...

Page 81: ...e value is or what its units are It is only important that the raw sensor input varies in direct proportion to the quantity being measured Calibration Procedures If you don t know whether a two point...

Page 82: ...to the Sensors screen or press to cancel the new calibration and revert to the previous or default calibration One Point Slope Calibration Procedure A one point slope calibration requires one known st...

Page 83: ...From the Sensor field select the desired sensor 2 From the Measurement field select the desired measurement 31 3 Set the Single All field to Calibrate all similar measurements 4 From the Calibration...

Page 84: ...List indicated by a dark box surrounding that section The focused section also has one of its items highlighted Press the down arrow key to move the focus from the Folder Selector to the File List se...

Page 85: ...mer that appears in the Sensors screen of the file receives a separate entry in the file list See Sensors Screen on page 55 Data runs If the file contains data collected from sensors each data run app...

Page 86: ...a file highlight it in the File List and press or click Delete A dialog box will ask for confirmation before the file is deleted select OK or Cancel You can use instead of to delete a single file If y...

Page 87: ...ns saved files other than the active file Move All Files is similar to Move File but it moves every saved file in the selected folder except the active file to the folder that you choose Copy File Thi...

Page 88: ...iment set up file Files saved in either RAM or Flash will remain saved even if the GLX s battery runs too low for normal operation When the battery drains to a critical level the GLX shuts down reserv...

Page 89: ...To back up the GLX go to the Data Files screen and press to open the Files menu select Backup GLX Files All data files in the Ram and Flash folders and all settings are copied to the flash drive To r...

Page 90: ...ions are controlled in the Settings screen of the host unit When a remote GLX is connected two additional folders appear in the Settings screen of the host GLX which represent the RAM and Flash folder...

Page 91: ...h GLX Highlight Name and press Type the new name36 and press Date Format The date shown in the Top Bar can be displayed in two formats month day year MM DD YY or day month year DD MM YY Highlight Date...

Page 92: ...age and press An arrow in the lower right corner of the menu indicates that more menu options are available but not visible press the down arrow key to move the highlight to the bottom of the menu the...

Page 93: ...he mic vol ume adjusts itself in response to the present sound level Speaker Volume This setting determines the loudness of audio note playback and sound output Output Device To play audio notes and s...

Page 94: ...88 S e t t i n g s S c r e e n...

Page 95: ...has a different icon Certain sensors make more than one measurement The data source menu pictured here is from a GLX connected to a Pressure Temperature Sensor Note that the two data sources have the...

Page 96: ...In multipress mode repeatedly pressing a key will cycle through these characters The 7 key will cycle through punctuation marks not all of which are printed on the key The characters in the cycle are...

Page 97: ...ave a space adjacent to the E The number to the left of the E can contain a decimal point but one is not required The number to the right of the E must not contain a decimal point Printing The Graph T...

Page 98: ...92 P r i n t i n g...

Page 99: ...ing the update to the GLX s USB port Open the Data Files screen see page 78 Press to open the Files menu and select Upgrade GLX Firmware Battery and Power Battery Charging To charge the battery simply...

Page 100: ...d off and disconnected from AC power When you are not using the GLX fol low these storage guidelines Whenever possible Keep the GLX connected to AC power Unplugged for more than a few days Backup your...

Page 101: ...le battery charge depends on many factors including the age and history of the battery the number and type of sensors connected the use of sound output and the backlight At an ambient temperature of 2...

Page 102: ...LX go to the Data Files screen see page 78 press to open the Files menu and press to select New File Previous data displays and sensor settings will be unloaded from the GLX and returned to their defa...

Page 103: ...nsor data sheets Operating Temperature The GLX can be operated and stored without damage at temperatures between 10 C and 40 C Do not leave the GLX in a parked car or other environment that may exceed...

Page 104: ...98 O p e r a t i n g T e m p e r a t u r e...

Page 105: ...B port of your computer Launching DataStudio If there is a new file saved on the GLX3 your computer will automatically launch DataStudio when the GLX is connected If there are sensors connected to the...

Page 106: ...described below Open The Open button is available when a file is selected When you click Open the selected file will be copied from the GLX DataStudio will translate it into a DataStudio file and open...

Page 107: ...ile with a glx extension GLX files can be created by a GLX or by the GLX Simulator Done Click Done to close the GLX File Manager To Transfer Files Between GLXs Through DataStudio You can also transfer...

Page 108: ...ataStudio file If you save it it will be saved with a ds extension Collecting Data with DataStudio When the GLX is connected to a computer running DataStudio sensor setup and data collection are contr...

Page 109: ...90 for keyboard equivalents Up to four PASPORT sensors connected to your computer through any type of PASPORT interface will be treated by the Simulator like sensors connected to a real GLX The GLX S...

Page 110: ...e Simulator The Copy Screen button will capture an image of the real GLX s screen File Transfer between Simulator and GLX Files that you have created or modified in the Simulator can be saved and tran...

Page 111: ...following pages contain step by step instructions for science activities and experiments that can be done with the GLX its included temperature and voltage probes and commonly available supplies no P...

Page 112: ......

Page 113: ...would like to save the previous file press to save or not to save Procedure Equipment Set Up 1 Fill a Styrofoam cup with hot water 2 Tie a string to each mass and lower all three masses into the hot w...

Page 114: ...es from the hot water Lower one mass into Cup 1 lower two masses into Cup 2 3 Gently stir the water in both cups 4 Press to automatically scale the Graph 5 After both temperature measurements have sta...

Page 115: ...p arrow to move one of the cursors to the first data point c Hold and press to swap control to the other cursor press the down arrow key to move that cursor to the last data point The Delta Tool shoul...

Page 116: ...110 C a l o r i m e t r y...

Page 117: ...cal test tube 3 Place a fast response temperature probe in each test tube The ends of the probes should be immersed Use tape to secure the probes in place 4 Label both test tubes and label the connect...

Page 118: ...Graph to display both temperature measurements a Press to return to the Home Screen press to open the Graph b Press to open the Graphs menu press to select Two Measure ments mode c Press to automatica...

Page 119: ...o open the Files menu and press to select New File 4 When the GLX asks if you would like to save the previous file press to save or not to save Procedure Equipment Set Up 1 Place a fast response tempe...

Page 120: ...newly selected sen sor to 10 seconds 3 Set up the Graph to display both temperatures a Press to return to the Home Screen press to open the Graph The Graph is automatically set up to display data fro...

Page 121: ...raph of Equation 2 is shown to the right In this experiment you will record and graph the temperature of a hot object a test tube full of sand as it cools You will then compare the experimental data w...

Page 122: ...side of the GLX b If there are other sensors connected to the GLX remove them 2 Set the sampling rate to 30 seconds between samples a Press to go to the Home Screen b Press to open the Sensors screen...

Page 123: ...rn to the Home Screen b Press to open the Graph display The display will be automatically set up to graph object temp versus Time c Press to open the Graphs menu and press to select Two Mea surements...

Page 124: ...culation 2 Make a new graph of r versus t a Press to return to the Home Screen press to open the Graph b Press to open the Graphs menu press to select New Graph Page c Press twice to open the data sou...

Page 125: ...lect ln r r0 7 Apply a linear fit and find the value of k a Press to open the Tools menu press to select Linear Fit b Press the down arrow key to make the dashed box surround the entire data set c The...

Page 126: ...lue for t 9 Compare collected relative temperature data with the modeled data a Press to return to the Home Screen press to open the Graph display b Press to open the Graphs menu press to select New G...

Page 127: ...e to save the previous file press to save or not to save Procedure Preparation Sketch a map of the area you will be investigating Mark several locations on the map and assign each a different short na...

Page 128: ...to record a single temperature measurement 5 The GLX will prompt you for Keyboard Data Press to turn off Num Lock Type the location name press each key repeatedly to cycle through different letters Pr...

Page 129: ...rrent and resistance and the total resistance of two or more resistors in series Before You Begin Start a new experiment on the GLX 1 Press to go to the Home Screen 2 Use the arrow keys to highlight t...

Page 130: ...ally entered resistance data will open c With Measurement Name highlighted press type r and press d Press the down arrow key to highlight Measurement Unit Press type ohm and press e Press to approve t...

Page 131: ...l prompt you to enter r the total resistance across which the voltage is measured For point A r 0 Type the value of r and press 6 Repeat steps 3 4 and 5 for points A through F 7 When you are finished...

Page 132: ...126 V o l t a g e v e r s u s R e s i s t a n c e...

Page 133: ...efore You Begin Start a new experiment on the GLX 1 Press to go to the Home Screen 2 Use the arrow keys to highlight the Data Files icon and press to open the Data Files screen 3 Press to open the Fil...

Page 134: ...rn to the Home Screen b Press to open the Graph display The display will be automatically set up to graph Voltage versus Time Data Collection 1 Hold the magnet about 2 cm above the coil 2 Press drop t...

Page 135: ...st peak See page 20 for detailed instructions on using the Area Tool Area under the first peak _________________ include sign and units 3 Find the area under the second peak Repeat step 2 to position...

Page 136: ...130 I n d u c e d E l e c t r o m o t i v e F o r c e...

Page 137: ...e in the diagram The GLX will measure and graph voltage over time as the capacitor discharges From the collected data you will determine the capacitive time constant of your circuit Before You Begin S...

Page 138: ...ge port on the left side of the GLX b If there are other sensors connected remove them 2 Set up the Graph to plot Voltage versus Time Press to return to the Home Screen press to open the Graph The dis...

Page 139: ...line enter2 ln Voltage V v0 To insert the ln function press to open the Functions menu used the arrow keys to highlight ln and press To insert Voltage V press to open the Data menu and select Voltage...

Page 140: ...s menu press to select Linear Fit b Press the down arrow key to make the dashed box surround the entire data set c The slope of the best fit line equals _________________ include units 5 Optional Repe...

Page 141: ...he GLX 1 Press to go to the Home Screen 2 Use the arrow keys to highlight the Data Files icon and press to open the Data Files screen 3 Press to open the Files menu and press to select New File 4 When...

Page 142: ...of the combined waves change 10 Listen to the sound At what values of phase does maximum destructive interference occur 11 Press the left arrow key to highlight the Phase of the Left Output Channel P...

Page 143: ...2 Use the arrow keys to highlight the Data Files icon and press to open the Data Files screen 3 Press to open the Files menu and press to select New File 4 When the GLX asks if you would like to save...

Page 144: ...en use the arrow keys to highlight Stopwatch and press 4 Count the beats zero one two three ten Press on beat zero to start timing Press again on beat ten to stop timing 5 Write the elapsed time of 10...

Page 145: ...You can do these calculations in your head 2 Press to return to the Home Screen press to open the Calculator Use the calculator to calculate the beat frequency f beat for each line of the chart 3 Acco...

Page 146: ...140 B e a t F r e q u e n c y...

Page 147: ...7 Digital Input timer 67 Digital output 51 67 Digits display 37 E Editing data 34 EE for Exponent settings 70 Engineering notation 70 Equipment included with GLX 4 Excel export data to 32 Export All D...

Page 148: ...o Display 86 Sensors calibration 71 multiple 55 removing 59 sampling rate 56 ScienceWorkshop 59 67 set up 55 Sensors screen 55 Settings screen 85 Set up options for GLX 6 Shut down 7 automatic 8 manua...

Page 149: ...ombinations work from any screen in the GLX environment Use these shortcuts when working in the Graph Screen Start and stop data collection Backlight Contrast Graph Table Calculator Sensors Home Scree...

Page 150: ......

Page 151: ...in which Licensed Type Software is embedded in a document in a format which may be edited altered enhanced or modified by the recipient of such document 4 The PASCO Product may not be duplicated or co...

Page 152: ......

Reviews: