X p l o r e r G L X U s e r s ’ G u i d e
69
D a ta P r o p e r t i e s
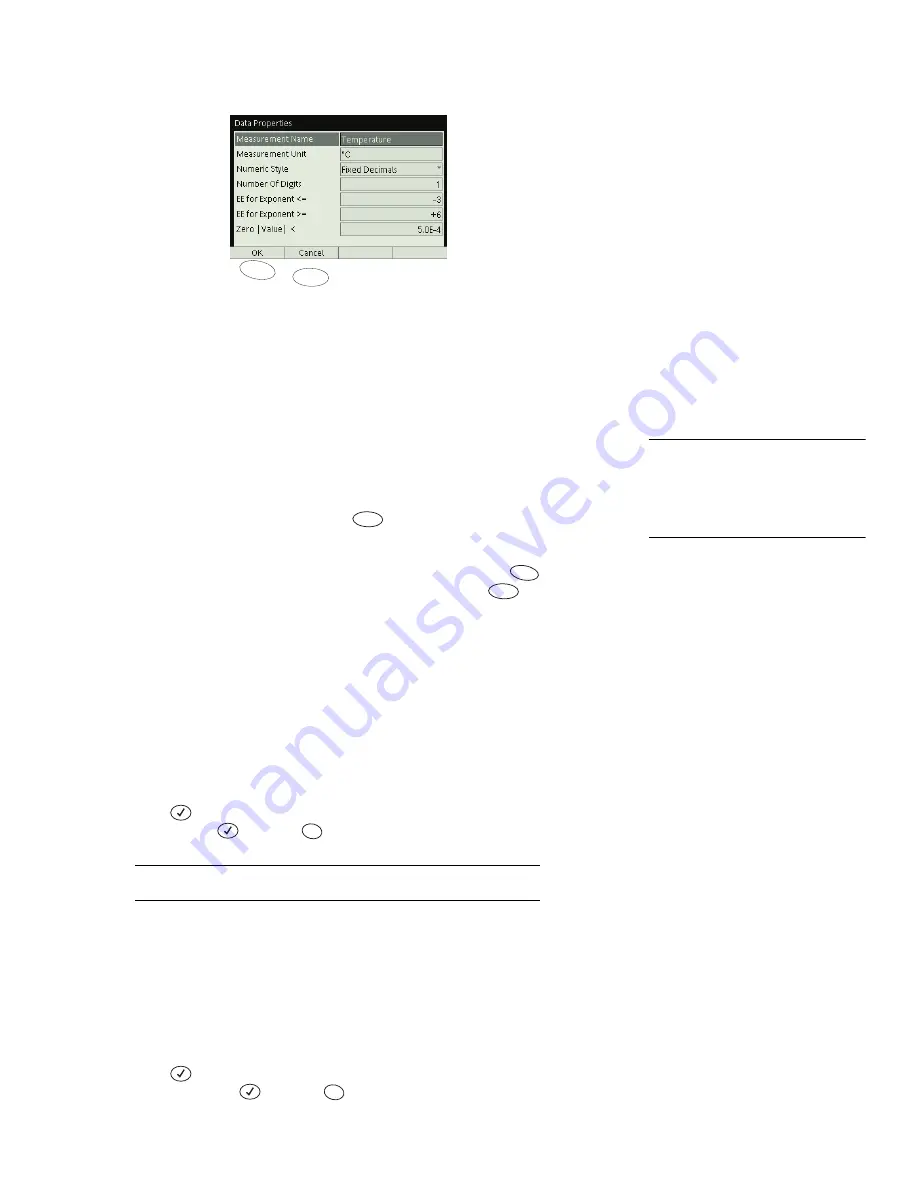
Every data set and data source in the GLX has data properties, which control how
the data are displayed in the Graph, Table, and other screens.
To Open the Data Properties Dialog Box
To access and edit the properties of a data source, set up the Graph or Table to
display the data source, then open the data source menu and select Properties.
26
The Data Properties dialog box will open.
You can also access the data properties of a sensor measurement from the Sen-
sors screen. In the Sensors screen, press
. (See page 55 for more informa-
tion.)
When you are finished viewing or editing the data properties, press
(OK) to
close the dialog box and return to the previous screen, or press
to cancel
any changes.
Navigating in the Data Properties Dialog Box
Measurement Name
The Measurement Name is the label that designates a
data source on a graph axis or at the top of a table column. You may want to edit
the Measurement Name to add more information about that measurement
(change “Temperature” to “Water Temperature,” for instance) or to shorten it
(change “Force” to “F,” for instance).
To edit the Measurement Name, use the up and down arrows keys to highlight it
and press
(or click it if you are using a mouse). Type the new name on the
keypad and press
(or press
to cancel).
See “Multipress Text Input Mode” on page 90 for instructions on using the
keypad to enter text.
Measurement Unit
The Measurement Unit is the name of units that are dis-
played on a graph axis or at the top of a table column.
You many want to edit the Measurement Unit to add units to a calculation or
manually entered data set, or to abbreviate or spell out the units of a sensor mea-
surement. For instance, you might change “m” to “meters.”
To edit the Measurement Unit, use the up and down arrows keys to highlight it
and press
(or click it if you are using a mouse). Type the new unit name on
the keypad and press
(or press
to cancel).
F2
F1
Data Properties dialog box
26
For instructions on displaying data in
the Graph and selecting items from the
data source menu, see pages 13 and 15.
For instructions on displaying data in the
Table and selecting items from the data
source menu, see pages 28 and 28.
F2
F1
F2
Esc
Esc
Summary of Contents for Xplorer GLX
Page 4: ......
Page 6: ......
Page 7: ...Part 1 Users Guide...
Page 8: ......
Page 18: ...12 O v e r v i e w o f t h e G L X...
Page 94: ...88 S e t t i n g s S c r e e n...
Page 98: ...92 P r i n t i n g...
Page 104: ...98 O p e r a t i n g T e m p e r a t u r e...
Page 112: ......
Page 116: ...110 C a l o r i m e t r y...
Page 132: ...126 V o l t a g e v e r s u s R e s i s t a n c e...
Page 136: ...130 I n d u c e d E l e c t r o m o t i v e F o r c e...
Page 146: ...140 B e a t F r e q u e n c y...
Page 150: ......
Page 152: ......


