background image

HDS2062M-N Handheld DSO & DMM 


7-Advanced Function of Oscilloscope


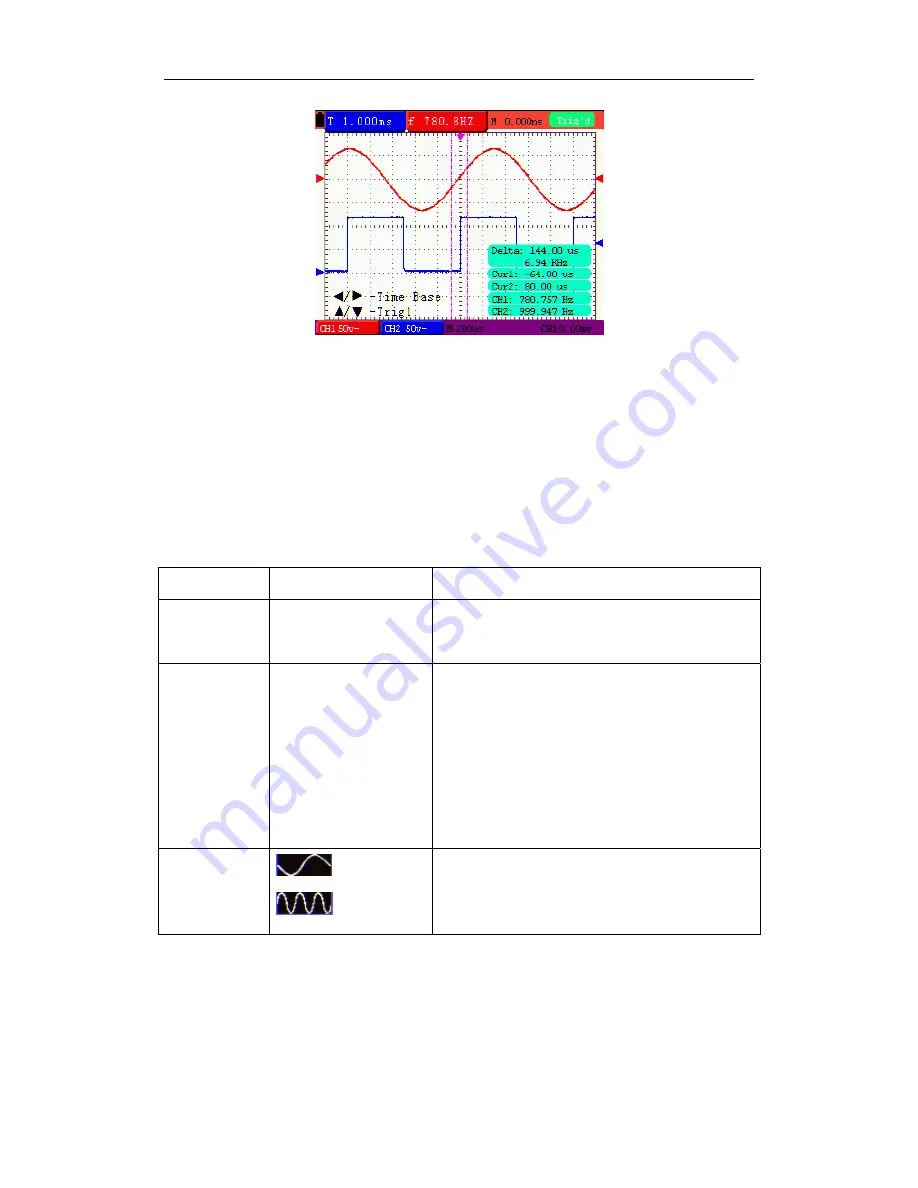
Figure 50: Use the Cursor for a Time Measurement 

7.12 Autoscale 

The function is applied to follow-up signals automatically even if the signals change 
at any time. Autoscale enables the instrument to set up trigger mode, voltage 
division and time scale automatically according to the type, amplitude and frequency 
of the signals. 
The menu is as follows: 

Function menus  Settings 

Description 

Autoscale OFF 

ON 

Turn off 

Autoscale


Turn on 

Autoscale 

Mode Vertical 


Horizontal 


HORI—VERT 

Follow-up and adjust vertical scale without 

changing horizontal setting 

Follow-up and adjust horizontal scale without 

changing vertical setting 
Follow-up and adjust the vertical and 
horizontal settings.


Only show one or two periods 
Show Multi-period waveforms


If you want to measure voltage of Channel 1, you can do as the follows: 
 
1. Press MENU, the function menu will appear on the right of the screen. 
2.Press


MUNU 


or 

MENU 


and choose


Autoscale

three options will show at the 

bottom of the screen. 

3. Press


F1

 and choose 

ON. 


54

Summary of Contents for Lilliput HDS2062M-N

Page 1: ...OWON HDS2062M N Handheld Digital Storage Oscilloscope Multimeter User s Manual WWW OWON COM CN 1 ...

Page 2: ...er arising from breach of warranty or based on contract tort reliance or any other theory its total liability is limited to repair or replacement of the product All replaced parts modules and products become the property of Lilliput Lilliput authorized dealer shall extend this warranty on new and unused products to end user customers only but have no authority to extend a greater or different warr...

Page 3: ...ut Connections 6 4 2 Front Panel and Keys Overview 6 5 USING THE OSCILLOSCOPE 9 5 1 About this Chapter 9 5 2 Powering Up the Oscilloscope 9 5 3 Oscilloscope Operation Window 9 5 4 Menu Description 11 5 5 Manually Setting the Vertical System Horizontal System and Trigger Position 11 5 6 Recall factory settings 15 5 7 Input Connections 15 5 8 Displaying an Unknown Signal with Auto Set 16 5 9 Automat...

Page 4: ...ment 33 6 7 Selecting Automatic ManualRange Adjustment 34 7 ADVANCED FUNCTION OF OSCILLOSCOPE 35 7 1 About this Chapter 35 7 2 Setting the Vertical CH1 and CH2 35 7 2 1 Setting the Channel Coupling 36 7 2 2 Open and Close Settings on Channel 37 7 2 3 Setting the probe attenuation 37 7 2 4 Setting of Inverted Waveform 37 7 3 Make the Math Function Menu Setting 38 7 4 Setting the Trigger System 39 7...

Page 5: ...Transmission 59 8 TROUBLE SHOOTING 60 9 APPENDIX 62 9 1 Appendix a Specifications 62 9 1 1 Oscilloscope 62 9 1 2 Meter 64 9 1 3 General Specifications 65 9 2 Appendix B Maintenance and Cleaning 66 9 2 1 Maintenance 66 9 2 2 Storage of Oscilloscope 66 9 2 3 Replacing the Lithium Battery Unit 67 9 3 Appendix C New Function 67 3 ...

Page 6: ...urement Control and Laboratory use part 1 General Requirements EN61326 1997 A1 1998 A2 2001 A3 2003 Electrical Equipment for Measurement Control and Laboratory use EMC Requirements part 1 General Requirements EN61000 3 2 2000 A2 2005 Electromagnetic Compatibility EMC part 3 Limits Section 2 Limits for Harmonic Current Emissions Equipment Input Current less than equal to 16A per phase EN61000 3 3 1...

Page 7: ... AC DC adapter 3 Oscilloscope Probe x 2 grey 4 Multimeter test lead x 2 black and red 5 USB Mass Storage connect cable 6 Extension module for small capacitance measurement 7 Probe adjustment tools 8 USB communication cable or RS 232C communication cable 9 User Manual 10 CD ROM software 11 Hard carrying case 12 Soft carrying case Figure 1 Digital Oscilloscope Parts 1 ...

Page 8: ... the product or other properties DANGER High Voltage Refer to the Manual Protective Conductor Terminal Chassis Ground Earth ground Terminal 2 1 2 Safety Terms The following terms may appear on the instrument Danger The term Danger is used in this manual to indicate that when you read this mark personal injury may be caused to you immediately Warning The term Warning is used in this manual to indic...

Page 9: ...s test leads and accessories that are not in use Always connect the power adapter first to the AC outlet before connecting it to the Oscilloscope Multimeter Do not apply voltages that differ more than 400 V from earth ground to any input when measuring in a CAT Ⅱ environment Do not apply voltages that differ more than 400 V from each other to the isolated inputs when measuring in a CAT Ⅱ environme...

Page 10: ...bare conductors When the product is powered on do not touch any bare joints or parts of the scope meter Operation is prohibited in case of any undetermined failure When in doubt any damage on this product consult the qualified personnel for checking on it Keep ventilation in good condition Refer to the user manual for detail installation instructions in order to fix this product correctly and prov...

Page 11: ... The accessory list has been described in the picture of Digital Oscilloscope Parts of this manual You can make a check and find whether there is any accessory loss with reference to the Appendix In case of any accessory loss or damage consult the OWON dealer responsible for such a business or the local office of OWON 3 3 3 Make a Check on the Complete Instrument If the instrument is damaged in it...

Page 12: ...ead 3 Multimeter input jacks including four circular banana jacks The first jack measuring the current 2 A 10A the second jack on the current Measurement the third COM ground input and the fourth measuring voltage resistance Capacitance input 4 Oscilloscope probes 5 Oscilloscope channel inputs the upper one is for Channel 1 CH1 while the lower one is for Channel 2 CH2 4 2 Front Panel and Keys Over...

Page 13: ...on 1 AC adapter Port 2 RS 232C Port 3 USB Port 4 USB Mass Storage Port 5 Power switch 6 F1 F5 Switch or Adjust options for each menu 7 AUTO SET Under DSO mode Automatically selects the horizontal scales vertical scale and trigger level according to the input signal 7 ...

Page 14: ... list 21 OPTION the key for DSO setting and combines with four arrow keys Then to set main time base trigger horizontal position and trigger vertical position Furthermore the keys possible to adjust the display multiplying factors of M waveform CHM and display vertical position CHM ZERO during waveform calculation and to adjust cursor 1 V1 or T1 and cursor 2 V2 or T2 position during cursor measure...

Page 15: ...e 1 The oscilloscope may still work with built in Li ion battery even without AC power supply Turn the oscilloscope on by pressing down the power on off key POW The instrument then performs Selfchecking after power on A greeting window and a sentence press any key to continue will display on the screen when the system finishes selfchecking The users can press any key to enter the measuring functio...

Page 16: ...waveform data 7 Red and blue index display triggers vertical position during alternate trigger and triggers index become green when it reaches edge trigger or video trigger 8 A hidden style menu With the MENU key pressed you can view or hide the menu 9 Menu setting options There are different setting options for different menus 10 It reads the value of trigger voltage level 11 The display shows th...

Page 17: ...ENU again will hide the Function Menu 2 Press the MENU or MENU key to select different function menus 3 Choose one key from F1 to F5 and press it to change function setting See the following figure 5 Figure 5 the Tool s Menus 5 5 Manually Setting the Vertical System Horizontal System and Trigger Position OPTION key for multiple setting key and to set trigger vertical position main time base and ho...

Page 18: ...wing is displayed at the bottom left side of the screen as shown in the figure below Time Base Trig See the following figure 6 Figure 6 2 Press yellow or yellow to adjust the main time base and press yellow or yellow to adjust trigger horizontal position 3 Press OPTION again and left bottom side display as Time Trig See the following figure 7 12 ...

Page 19: ... or yellow to adjust time base horizontal position press yellow or yellow to adjust trigger position 5 Press OPTION again to back operation 1 When trigger mode during alternate trigger 6 Press OPTION and left bottom display as Time Trig 2 See the following figure 8 figure 8 13 ...

Page 20: ...on of the display area through the adjustment of which you can amplify or attenuate the signal and thus regulate the signal amplitude into the expected measurement range z Vertical zero position It is referred to as the grounding datum point through the adjustment of which you can regulate the display position of the waveform on the screen z Main time base It means the time values represented by a...

Page 21: ... Auto calibration If the ambient temperature variation is up to or larger than 5 Celsius degree the Auto calibration function should be performed But will not affect the using and capability by the heat from LCD and electronic component See the following figure 10 figure 10 Reset the Oscilloscope 5 7 Input Connections See figure 2 Look at the bottom and the right of the Oscilloscope The Oscillosco...

Page 22: ...ition automatically returns to zero 2 Press R key the trigger level position automatically returns to zero 5 10 Automatic Measurements The Oscilloscope offers 5 ranges of automatic scope measurements Your can display two numeric readings measurement 1 and measurement 2 These readings are selectable independently and the measurements can be done on the input CH1 or input CH2 waveform To choose a fr...

Page 23: ...Measurements 5 11 Freezing the Screen You can freeze the screen all readings and waveforms 1 Press the RUN STOP key to freeze the screen and STOP appears at top right side of the screen 2 Press the RUN STOP key once more to resume your measurement See the following figure 12 Figure 12 Freezing the Screen 17 ...

Page 24: ...of the screen 3 Press the F3 key to select Average Factors then press F4 key to jump to Averages 16 item This averages the outcomes of 16 acquisitions and shows the final averaging result on the screen shown as the following figures See the following figure 13 Figure 13 Average Factor Sampling Mode 5 13 Using Persistence to Display Waveforms You can use Persistence to observe dynamic signals 1 Pre...

Page 25: ...se this function to display events glitches or other asynchronous waveforms of 50 ns or wider 1 Press MENU key and the function menu appear at the right side of the screen 2 Press MENU or MENU key to select the ACQU MODE Four items selectable are displayed at the bottom of the screen 3 Press F2 key and jump to Glitch Detect In this case you can test the glitch Now you can see a screen that looks l...

Page 26: ... the sampled data in this mode thus by which the oscilloscope may collect the possibly lost narrow pulse in the sampling mode but the noise is obvious Averaging values the oscilloscope collects several waveforms and average over them and displays the averaged waveform in this mode by which the random noise can be reduced Duration time When a new waveform is displayed the previous waveform shown on...

Page 27: ...tom left side of the screen displays the ac coupling icon Now you can see a screen that looks like the following figure 16 Figure 16 AC Coupling 5 16 Reversing the Polarity of the Displayed Waveform To invert the input CH1 waveform do the following 1 Press the MENU key and the function menu appears at the right side of the screen 2 Press the MENU or MENU key to select CH1 setting Four items select...

Page 28: ...tics function do the following 1 Press the MENU key and the function menu is displayed at the right side of the screen 2 Press the MENU or MENU key to select the Waveform Calculation Five items selectable appears at the bottom of the screen 3 Press F3 key to select CH1 CH2 and the calculated waveform M green appears on the screen Again press the F3 key to close Waveform Calculation 4 Press OPTION ...

Page 29: ...to the U disk There is two formats available for choice Vector format and Bitmap which the corresponding name will be WAVE1 BIN WAVE2 BIN WAVE3 BIN or WAVE1 BMP WAVE2 BMP WAVE3 BMP Then you can open the files in computer by connecting USB disk to computer Noted During the U disk saving procedure some notes such as Waveform saving Waveform saved USB already connected USB connection interrupt etc wi...

Page 30: ...nus and perform basic operations 6 2 Making Meter Connections Use the four 4 mm safety banana jack inputs for the Meter functions COM V Ω C 10A mA See figure 2 for the connections 6 3 Multimeter Operation Window Figure 19 Multimeter Operation Window Description 1 Battery electric quantity indictor 2 Manual Auto range indictors among which the MANUAL means measuring range in manual operation mode a...

Page 31: ... measurement result 8 The mail reading of measurement 9 Automatic control measuring range 10 Absolute relative magnitude measuring control The sign expresses the absolute magnitude measuring control and represents the relative magnitude measuring control Manually measuring range control 11 Manual measurement control 12 Test lead indicated the scale of test reading different test modes display diff...

Page 32: ...g figure 20 Figure 20 Resistance Measurement 6 4 2 Measuring Diode To make a measurement on the diode do the following 1 Press the R key and R appears at the top of the screen 2 Press SET key till the following is displayed on the screen 3 Insert the black lead into the COM banana jack input and the red lead into the V Ω C banana jack input 4 Connect the red and black leads to the resistor and the...

Page 33: ...shown on the screen 3 Insert the black lead into the COM banana jack input and the red lead into the V Ω C banana jack input 4 Connect the red and black leads to the test point If the resistance value of the tested point is less than 50Ω you will hear beep sound from the test tool Now you can see a screen that looks like the following figure 22 Figure 22 On off Test 6 4 4 Measuring Capacitance To ...

Page 34: ...elative value measuring mode to improve measuring precision It will take about 30seconds if capacitance measurement is large than 40uF Now you can see a screen that looks like the following figure 23 Figure 23 Capacitance Measurement 6 4 5 Measuring DC Voltage To measure a DC voltage do the following 1 Press the V key and DCV appears at the top of the screen 2 Insert the black lead into the COM ba...

Page 35: ... Press the SET key and ACV appears at the top of the screen 3 Insert the black lead into the COM banana jack input and the red lead into the V Ω C banana jack input 4 Connect the red and black leads to the measured points and the AC voltage values of measured points will be displayed on the screen Look at the display you can see a screen that looks like the following figure 25 Figure 25 AC Voltage...

Page 36: ...t values of measured points will be displayed on the screen Look at the display you can see a screen that looks like the following figure 26 figure 26 DC Current Measurement for 400 mA To measure a DC current which is larger than 400 mA do the following 1 Press the A key and DCA appears at the top of the screen The unit on the main reading screen is mA 2 Press F5 key change to 10A measurement the ...

Page 37: ...tom of screen press F4 or F5 to switch the measurement between mA and 10A 400mA is acquiescently 2 Press the SET key once and ACA is visible at the top of the screen 3 Insert the black lead into the COM banana jack input and the red lead into the mA banana jack input 4 Connect the red and black leads to the measured point and the AC current value of the measured point will be displayed on the scre...

Page 38: ...to the measured point and the AC current value of the measured point will be displayed on the screen 5 Press F4 return to 400mA measure Look at the display you can see a screen that looks like the following figure 29 figure 29 AC Current Measurement for 10A 6 5 Freezing the Readings You can freeze the displayed readings at any time 1 Press the RUN STOP key to freeze the screen and STOP will be dis...

Page 39: ...value 1 Press R key and R is displayed on the top side of the screen 2 Press the SET key till C appears at the top of the screen 3 Plug capacitance extended module in capacitance measure jack 4 When the reading leveling off press F2 key and is displayed on the top side of the screen The saved reference value is displayed below 5 Plug capacitance the displayed major reading on the screen is actual ...

Page 40: ...eased by a stage when pressing F1 key each time and when reaching the highest stage it jumps to the lowest stage by pressing F1 key once again To multiply the reading of dial pointer by multiplying power and the unit of main reading on the screen will get the measurement result 3 Press F3 key and AUTO is displayed on the top left side of the screen to switch back to the automatic range mode Look a...

Page 41: ...rtical menu and each item can be set respectively based on the specific channel To make vertical CH1 and CH2 settings do the following 1 Press the MENU key and the function menu appears at the right of the screen 2 Press the MENU or MENU key to jump to CH1 Setting and 4 options appears at the bottom of the screen 3 Select key from F1 to F4 to make different settings Now you can find a screen that ...

Page 42: ... probe attenuation level to ensure a correct vertical scale reading Inverted OFF ON Waveform is displayed normally Open the Invert function of the waveform setting 7 2 1 Setting the Channel Coupling With CH1 taken for example Press F1 Coupling first and then AC to make an AC coupling setting The DC component contained in the tested signal is blocked Press F1 Coupling first and then DC to make a DC...

Page 43: ...level to the 10X position to prevent excessive voltage After attenuating the probe level by 10X you also need to magnify the display level by 10X to match the displayed amplitude with the real amplitude Press F3 Probe to adjust the probe attenuation level Table Probe attenuation level and the corresponding menu setting Probe attenuation level Corresponding Menu Setting 1 1 1X 10 1 10X 100 1 100X 1...

Page 44: ...tion table Setting Description CH1 CH2 CH1 waveform minus CH2 waveform CH2 CH1 CH2 waveform minus CH1 waveform CH1 CH2 Add CH1 waveform into CH2 waveform CH1 CH2 Multiply CH1 waveform and CH2 waveform CH1 CH2 Divide CH1 waveform by CH2 waveform To perform the CH1 CH2 waveform calculation do the following 1 Press the MENU key and the function menu appears at the right of the screen 2 Press the MENU...

Page 45: ...ected the oscilloscope gathers enough data continuously to draw the waveform at the right side of the triggering point To make a trigger mode setting do the following 1 Press the MENU key and the function menu appears at the right of the screen 2 Press the MENU or MENU key to select TRIG MODE and five options are displayed at the bottom of the screen 3 Select from F1 to F5 key to make a different ...

Page 46: ... Perform video field trigger or line trigger on the standard video signals Alternate trigger When the signal frequency different in Channel 1 and 2 it can also guarantee the stability approaching in two channels The following describes the Edge triggering Video triggering and Alternating triggering menus respectively 7 5 1 Edge Triggering The Edge triggering is a mode by which trigger occurs at th...

Page 47: ...is mode selected the DC component is prevented from passing though All components are allowed The HF part of the signal is prohibited and only the LF component is allowed The LF part of the signal is prohibited and only the HF component is allowed SENS Set trigger sensitivity Term interpretation Sensitivity Trigger circuit including sluggish in order to exclude the influences from signal noise and...

Page 48: ... Handheld DSO DMM 7 Advanced Function of Oscilloscope Figure 38 Video Field Trigger Figure 39 Video Line trigger Figure 40 Video Modulation Trigger The Video triggering menu is described in the following table 42 ...

Page 49: ...nous trigger in video odd line Set synchronous trigger in video even line Set synchronous trigger in video Line NUM Set synchronization and account choose video standard Set synchronization and account choose video standard Press F3 the Line value will increase Press F3 the Line value will decrease Show the Line value 7 5 3 Alternate trigger During alternate trigger the trigger signal mainly comes...

Page 50: ...ger type and others info for Channel 1 Setting trigger type and others info for Channel 2 Type Edge Video Set vertical channel trigger as edge trigger Set vertical channel trigger as video trigger Video type Polarity Normal Inverted Applicable to the video signal of which the black level is low Applicable to the video signal of which the black level is high Sync Synchronization MODU Modulation Lin...

Page 51: ...ng the acquisition mode The Acquiring Mode menu is described in the list shown as below Function menu Settings Description Sample The waveform data is sampled at an equal time interval The sample mode accurately reconstructs the waveform but cannot respond to rapid changes and sudden peaks Peak Detect The maximum and minimum data in the sampling interval are picked up The peak detect mode captures...

Page 52: ...2 on the vertical axis Carry Bitmap Vectors The data transmitted in communication are bitmaps The data transmitted in communication are vectors Cymometer ON OFF to set up cymometer limit to ON status to set up cymometer limit to OFF status 7 7 1 Display Style The display style includes Vector and Dot displays shown as the following figure 42 figure 43 Figure 42 Dot Style Figure 43 Vector Style 46 ...

Page 53: ... horizontal scale and position The CH2 VOL and CH2 ZERO for CH2 are used to set the vertical scale and position continuously The following functions do not work in the XY display mode Reference or digital value waveform Cursor Time base control Trigger control 7 7 4 Cymometer Its measurement rang of frenquency is 2Hz 60MHz Set up cymometer limit to ON status when the triggering mode is edge trigge...

Page 54: ...address for saving or recalling a waveform Save Store the waveform of a selected signal source into the selected address Show ON OFF Close or start displaying the waveforms stored in address A B C or D To save a waveform on CH1 in address A do the following 1 Press the MENU key and the function menu appears at the right of the screen 2 Press the MENU or MENU key to select the Waveform Saving Four ...

Page 55: ...ettings Auto Calibration Perform the Auto calibration procedure Language Chinese English Select the display language Auto calibration The Auto calibration function automatically configures internal parameters to maintain the sensitivity and accuracy Run the Auto calibration in the following cases When the temperature fluctuates more than 5 degrees Celsius during operations When operating the oscil...

Page 56: ...value of CH1 Measure the average value of CH2 Peak Peak CH1 CH2 Measure the peak to peak value of CH1 Measure the peak to peak value of CH2 Cyc RMS CH1 CH2 Measure Root Mean Square RMS value of CH1 Measure Root Mean Square RMS value of CH2 To measure the frequency of CH1 with Measurement 1 and the frequency of CH2 with Measurement 2 do the following 1 Press the MENU key and the function menu is sh...

Page 57: ...lose the cursor measurement Display the voltage measurement cursor and menu Display the time measurement cursor and menu Source CH1 CH2 Select the waveform channel on which the cursor measurement will be performed Delta Display the difference of measured value between the two channels Cur1 Display the relating measured value of Cursor 1 Cur2 Display the relating measured value of Cursor 2 To make ...

Page 58: ...move up and down and the relating voltage value to the zero position of Channel 1 will show at the bottom of the screen Setting OSC or OSC V1 will move up and down and the relating voltage value to the zero position of Channel 1 will show at the bottom of the screen at the same time the increment shows the absolute value of V1 V2 shown as Fig 47 Now you can see a screen that looks like the followi...

Page 59: ...vertical dashed lines T1 and T2 appear on the screen 4 Press the F2 key and jump to the measured channel CH1 5 Press OPTION and display as Cursor 2 Cursor 1 Press yellow or yellow and see T1 move left and right and LCD display the time value match T1 to point position in panel press yellow or yellow and see T2 move left and right and LCD display the time value match T2 to point position in panel N...

Page 60: ...ettings Description Autoscale OFF ON Turn off Autoscale Turn on Autoscale Mode Vertical Horizontal HORI VERT Follow up and adjust vertical scale without changing horizontal setting Follow up and adjust horizontal scale without changing vertical setting Follow up and adjust the vertical and horizontal settings Only show one or two periods Show Multi period waveforms If you want to measure voltage o...

Page 61: ... top left corner flicker every 0 5 second If the Autoscale function is off pressing AUTOSET is just to enter into AUTOSET function 5 Press F2 and choose Horizontal Vertical 6 Press F3 and displays on the screen as figure 51 Figure 51 Autoscale Horizontal Vertical multi period waveforms Figure 52 Autoscale Horizontal Vertical mono period waveform 55 ...

Page 62: ... status 3 At the mode of Autoscale DSO is always in the state of DC coupling and AUTO triggering In this case the forbidden information will be showing when making Triggering or Coupling settings 4 At the mode of Autoscale if adjust the vertical position voltage division trigger level or time scale of CH1 or CH2 the oscilloscope will turn off Autoscale function and if press AUTOSET again the oscil...

Page 63: ...bottom of the screen 3 Sequentially press F1 to F4 key and the corresponding state information will be shown on the screen 4 The screen that looks like the following figure 55 will be displayed Figure 55 System State 7 14 Setting of Time Base Mode The time base mode menu is explained as the following table Function menu Setting Explanation Main TimeBase Horizontal main time base is used to wave di...

Page 64: ...w area defined by two cursors the window size will vary 5 Press OPTION key and call TIME at this time press yellow and yellow to adjust the window position defined by two cursors the window position is the time difference of the window center to main time base s horizontal pointer 6 Press F3 key select window extension the defined window extends into the full screen display The screen that looks l...

Page 65: ...on menu on the right side of the screen 2 Press MENU or MENU key to select display setting mode display four options at the bottom 3 Press F4 key select the Bitmap or Vectors for data transmission 4 Use a data line to connect the oscilloscope and the PC 5 Open the OWON software that had been installed completely 6 Setting the parameter under the use s manual and then starts data transmission 59 ...

Page 66: ... 3 The measurement type displays ERR when you switch to the Multimeter mode Probably you do not select the measuring mode In this case push down any key of the three keys V A or R Thus the relative measuring mode will be shown on the screen If the ERR is still displayed restart the oscilloscope 4 The measured voltage amplitude value is 10 times larger or smaller than the real value under the oscil...

Page 67: ...r the trigger mode in the trigger mode menu is in normal or single shot and whether the trigger level is out of the waveform range In such condition adjust and make the trigger level in the middle or select the non auto trigger mode Additionally press the AUTO SET key and complete the above setting 7 When select the average sampling in the sampling mode or select a longer display time in the displ...

Page 68: ...ion procedure Except those specifications marked with the word Typical all specifications can be up to Sampling Sampling modes Normal sampling Peak detection Average value Sampling rate 250 MSa s Input Input coupling DC AC Input impedance 1MΩ 2 connected in parallel with 15pF 5pF Probe attenuation coefficient 1X 10X 100X 1000X Max Input voltage 400V peak Channel delay time typical 150ps Horizontal...

Page 69: ...ity Edge triggering AC coupling Same as the DC coupling when it is equal to or larger than 50Hz Triggering level range 6 divisions from the screen center Triggering level accuracy typical which is applicable to the signal with rise and fall time equal to or longer than 20ns 0 3 divisions Trigger displacement 655 divisions for pre triggering and 4 divisions for post triggering Make a 50 level setti...

Page 70: ...nput Impedance 10MΩ Max Input Voltage 1000V DC or AC peak to peak value Range Accuracy Resolution 400 0mv 1 5 2digit 100uV 4 000V 1mV 40 00V 10mV 400 0V 1 1 digit 100mV Voltage VAC Input Impedance 10MΩ Max Input Voltage 400V AC virtual value Frequency range from 40Hz to 400Hz Display Virtual value of the sine wave Range Accuracy Resolution 4 000V 1mV 40 00V 10mV 400 0V 1 3 digits 100mV Direct Curr...

Page 71: ...solution 51 20nF 10pF 512 0nF 100pF 5 120uF 1nF 51 20uF 10nF 100uF 3 3 digit 100nF Diode Voltage reading 0 V 1 5 V On off Test There is a beep sound when the on resistance is less than 50Ω 9 1 3 General Specifications Basic parameter Mechanical dimension 18 cm 11 5cm 4cm Weight 645 g Power consumption 7 W Display type 3 7 color liquid crystal display Display resolution 640 horizontal 480 vertical ...

Page 72: ...ng Inspect the instrument and the probe frequently in accordance with operating conditions Clean the outer surface of the instrument according to the following steps 1 Wipe off the floating dust outside of the instrument and the probe by using soft cloth When cleaning the LCD do not scuff the transparent LCD protective screen 2 Wipe the instrument in power off status by soft cloth that is moist bu...

Page 73: ...to charge the battery The charging speed can be increased by turning off the test tool Notice To avoid superheat of battery during charging the environment temperature is not allowed to exceed the permissible value given in technical specification Note No hazard will occur even connecting the charger for a long time e g during a whole weekend The instrument can automatically switch to slowly charg...

Page 74: ...HDS2062M N Handheld DSO DMM 9 Appendix Fig58 the connection of Square wave test signal Fig59 the output terminal of 1KHz 5V square wave test signal 68 ...

Reviews: