


Moxi Flow
™
User Guide
Page 14
Managing the Data
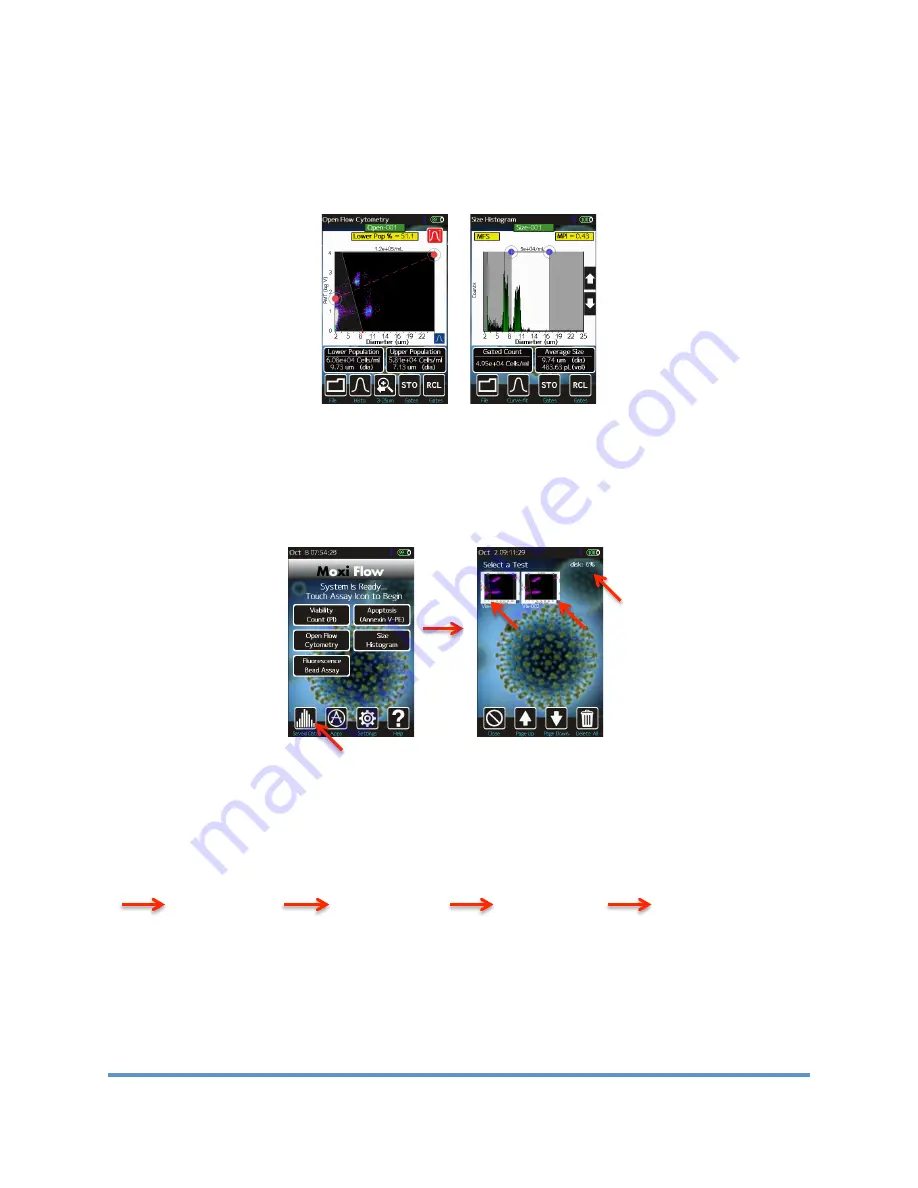
Test results are presented to the user immediately following a test in the form of a scatter (dot)
plot (below/left) for fluorescent tests or as a size-only histogram (bottom/right, “Size Histogram”
test only).
Saved tests can be accessed by selecting the
Saved Data
icon off of the
Home
screen (Image
below left). Once selected, the user is presented with a list of saved test thumbnails (image
below right), ordered by test date/time.
Note: the disk usage percentage is indicated in the
upper right corner of this screen
. Selecting a thumbnail opens that test for editing, identical to
the post-test editing, with the exception that the size (x) axis rescale and noise gating
capabilities are no longer available.
General Recommended Post-Test Workflow
Adjust the size
(x) axis to
optimize the
size
resolution.
Gate the test
results based
on fluorescent
intensity (red
markers).
Gate the test
results based
on size (blue
markers).
Read results and
perform file
operations (e.g.
export screenshot,
save, save gates)
Verify that the
noise auto-find
feature
properly
identifies the
noise. Adjust if
necessary.


