9 C-Quant Program
Instruction Manual C-Quant ( G/80000/1007/en)
25 / 56
When this option is deactivated the next stimulus can be called up by clicking on [Next].
9.1.3
Result fields
Note
In the following sections a sub-opitmal measurement is chosen as example. See
sect. 12.1, page 35, example 4.
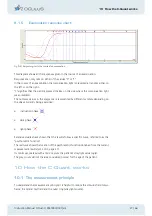
Numerical
Fig. 9-6: Results shown numerically
Here the result of (
Log(s
) = patient’s straylight value) of the current examination is shown
numerically.
In addition the field shows the
examination date
, the patient’s
age
at the time of exam-
ination, the examination duration and the quality parameters Esd and Q.
Esd
is the expected standard deviation of the individual measurement value in case
of repeated measurements.
The smaller Esd is, the more reliable the result.
Q is a further quality criterion. In this case the result is the more reliable the higher
the value is.
If Esd < 0.08 and Q > 1, the reliability of the result is considered to be good.
If Esd < 0.08 and Q > 0.5, the reliability is considered to be acceptable.
A warning is given if Esd > 0.08 or Q < 0.5.
[On the right is a field for entering comments on the examination performed].


