


®
8
O2
GLO
DATA
PLUS
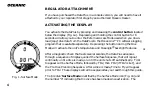
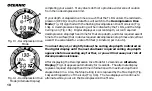
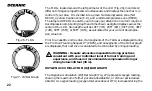
When underwater, you can quickly focus on the three bar graphs to make sure
that they are in the green. You can quickly verify that you’re not getting too
close to the no decompression limit, or the oxygen tolerance limit, or ascending
too fast.
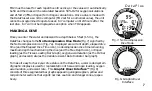
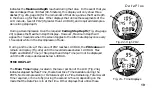
The Tissue Loading Bar Graph
®
(Fig 9) represents nitrogen loading, showing
your relative no decompression or decompression status. As your depth and
elapsed dive time increase, segments will fill the graph to form an arc along the
left perimeter of the LCD. As you ascend to shallower depths, this bar graph will
begin to recede, indicating that additional no decompression time is allowed for
multilevel diving. The TLBG also assists you with managing decompression by
filling a large red 'ceiling stop required' segment. This is explained in detail in
the Handling the Extremes section.
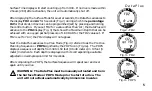
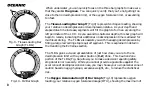
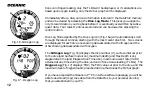
The TLBG gives a visual representation of just how close you are to the no
decompression limit with a yellow Caution (C.Z.) Zone. This Caution Zone
portion of the TLBG (Fig. 9a) allows you to make a decision regarding safety
stop duration or necessity. While you cannot provide a guarantee against the
occurrence of decompression sickness, you may choose your own personal zone of
caution based on age, physique, excessive weight, etc., to reduce the statistical
risk.
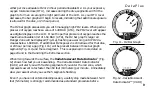
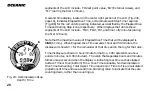
The Oxygen Accumulation (O2) Bar Graph (Fig. 10) represents oxygen
loading, your relative oxygen tolerance dosage (OTU), showing the maximum of
Fig. 10 - O2 Bar Graph
O2
GLO
DATA
PLUS
Fig. 9 - Tissue Loading Bar
Graph (TLBG)
a
Summary of Contents for DATA PLUS
Page 1: ...owner s guide DATA PLUS OCEANIC R3 ...
Page 2: ... ii ...
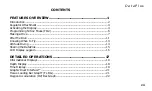
Page 11: ...FEATURES OVERVIEW ...
Page 27: ...DETAILED OPERATIONS ...
Page 53: ...HANDLING THE EXTREMES ...
Page 73: ...CARE MAINTENANCE ...
Page 85: ...REFERENCE ...
Page 105: ...DataPlus 95 ...


