


¨
16
GRAPHIC DIVER INTERFACE
™
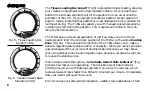
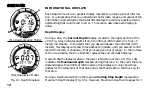
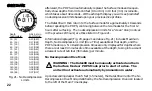
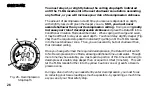
Two bar graphs referred to as the Graphic Diver Interface™ are located around
the perimeter of the Data100's LCD. They are color coded green, yellow, and red
to denote normal, caution and danger zones, respectively. The Graphic Diver
Interface allows you to make quick status checks underwater of your no decom-
pression status and ascent rate. Keeping these bar graphs in the green at all
times will reduce your exposure to decompression sickness and the effects of an
excessive ascent rate.
Tissue Loading Bar Graph
®
(TLBG)
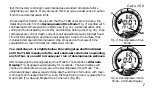
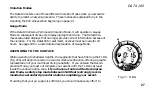
The Tissue Loading Bar Graph
®
(TLBG) represents nitrogen loading, showing
your relative no decompression or decompression status. As your depth and
bottom time increase, segments will add to the graph in an arc beginning from
the lower left. As you ascend to shallower depths, the TLBG will begin to recede,
indicating that additional no decompression time is allowed for multilevel diving.
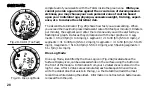
The TLBG also assists you with managing decompression by indicating six
'ceiling'
(stop) depths, which are explained in more detail in the Handling the
Extremes section.
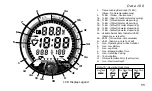
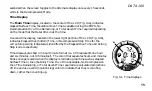
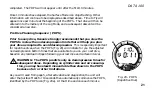
The TLBG, located around the outside edge of the LCD (Fig. 15), monitors 12
different nitrogen compartments simultaneously and displays the one that is in
control of your dive. It is divided into a green No Decompression zone, a yellow
Caution zone, and a red Decompression zone. The red Decompression zone is
Fig. 15 - TLBG
GLO
DATA
100
Summary of Contents for Data 100
Page 1: ...owner s guide Data 100 OCEANIC...
Page 2: ......
Page 11: ...THE DATA100 IS EASY TO USE...
Page 23: ...DETAILED OPERATIONS GUIDE...
Page 43: ...HANDLING THE EXTREMES...
Page 57: ...CARE and MAINTENANCE...
Page 69: ...REFERENCE...
Page 87: ...DATA100 77 NOTES...
Page 91: ......


