


Chapter 8. Counting and Analysis Workflow
8001009 Cellometer® Auto T4 User Manual Rev C
37
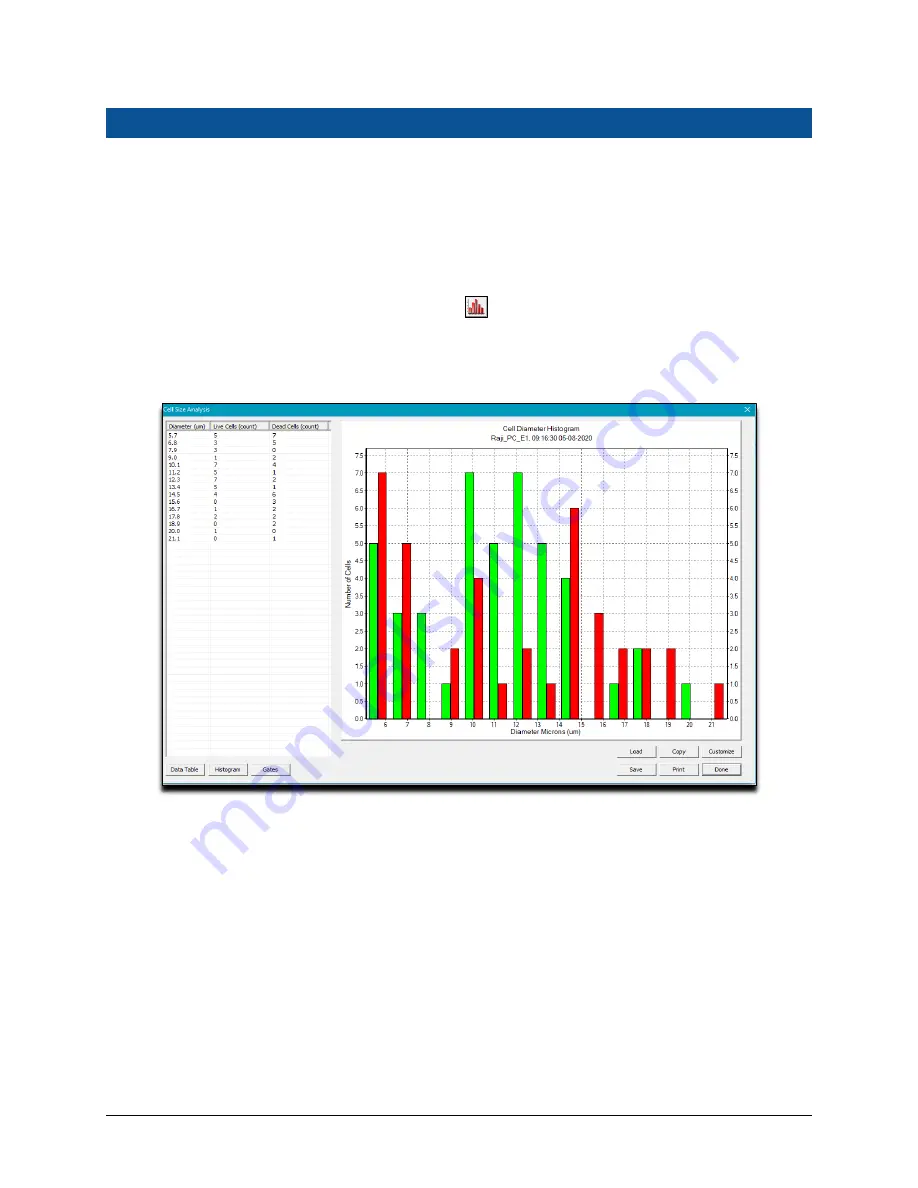
VIEW CELL SIZE ANALYSIS
The
Cell Size Analysis
tool displays cell size data from count results by generating a histogram that enables users to
optimize cell diameter parameters for the sample (e.g., to exclude debris or very large cells) and refine count data.
By overlaying data from multiple samples into a single histogram, users can create an analysis of the change in cell
diameter size over time.
To use the
Cell Size Analysis
tool, you must first perform a count on either a live or saved image to display the
diameter for each object found, as well as the mean diameter for cells in your sample (including dead cells if
Test
Viability
was selected). Click on the
Cell Size Analysis
icon to plot this information into a
Cell Diameter
Histogram
illustrating cell size distribution in the sample.
The tool plots cell size diameter distribution (
Size Microns
on the
X
axis) against the
Percentage of Total Count
(
Percent
on the
Y
axis), with the scales of each axis determined by count results.
The coloring of bars reflects the nature of cells similar to how the graphic overlay is used to highlight counted cells
(e.g., if testing for viability,
green
outlines live cells while
red
outlines dead cells). Other features of the histogram
such as bar width,
X
/
Y
axis scales and number of bins used in the graph can be defined by clicking the
Customize
button. To view different aspects of the data, switch between the
Data Table
,
Histogram
and
Gates
buttons.
In addition, you can perform the following tasks:
1.
To overlay data from multiple samples into a single histogram, click the
Load
button and navigate to additional
diameter files.
2.
Click the
Copy
button to copy the graph to your Windows clipboard, the
button to send it to a printer on
the network or the
Save
button to save histogram data as a file.
Alternatively, this tool can be activated by selecting the
Cell Size Analysis
option from the Analysis Menu.
Summary of Contents for Cellometer Auto T4
Page 1: ......
Page 6: ...Table of Contents 8001009 Cellometer Auto T4 User Manual Rev C vi ...
Page 12: ...Chapter 1 Introduction 8001009 Cellometer Auto T4 User Manual Rev C 6 ...
Page 16: ...Chapter 2 Equipment Safety 8001009 Cellometer Auto T4 User Manual Rev C 10 ...
Page 26: ...Chapter 5 Operation 8001009 Cellometer Auto T4 User Manual Rev C 20 ...
Page 36: ...Chapter 6 Software GUI Elements 8001009 Cellometer Auto T4 User Manual Rev C 30 ...
Page 46: ...Chapter 8 Counting and Analysis Workflow 8001009 Cellometer Auto T4 User Manual Rev C 40 ...
Page 56: ...Chapter 9 Cell Types 8001009 Cellometer Auto T4 User Manual Rev C 50 ...
Page 66: ...Chapter 13 Nexcelom Support 8001009 Cellometer Auto T4 User Manual Rev C 60 ...
Page 70: ...Appendix A Consumables 8001009 Cellometer Auto T4 User Manual Rev C 64 ...
Page 72: ...Appendix B Declaration of Conformity 8001009 Cellometer Auto T4 User Manual Rev C 66 ...