


Issue 1.1 April 2006
Page 103
•
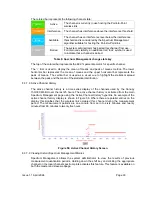
Histogram 2: 24 hours at a resolution of 1 minute
•
Histogram 3: 30 Days at a resolution of 1 hour
For example when histogram 1 fills up and starts to overflow the first minute of overflow is
analysed and the maximum, minimum and mean over that minute is computed and inserted
into histogram 2. When histogram 2 fills up and starts to overflow the first hour of overflow is
analysed and the maximum, minimum and mean over that hour is computed and inserted into
histogram 3 - When histogram 3 start to overflow the overflow data is simply discarded.
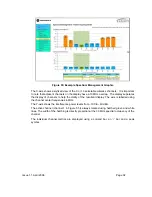
8.3.11.1 Diagnostic
Plotter
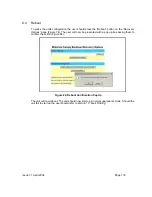
New for 58200 is the system administration diagnostic plotter facility see Figure 64.
Figure 64: Diagnostic Plotter
The diagnostic plotter allows the system administrator to view the cascading histogram data
in an easily accessible graphical form. The plot always displays three traces, maximum,
minimum and mean by default. The diagnostic selector allows the user to select the various
categories of histogram. The histograms that are available are:
•
Vector
Error
•
Rx
Power
•
Tx
Power
•
Signal Strength Ratio
•
Link
Loss
•
Rx Data Rate
•
Tx Data Rate
•
Aggregate Data Rate
Summary of Contents for Canopy 150 Mbps Backhaul
Page 1: ...Canopy 150 300 Mbps Backhaul User Guide BH150 300 UG en Issue 1 1 April 2006 ...
Page 25: ...Issue 1 1 April 2006 Page 24 Figure 5 Canopy 150 300 PIDU Power Input ...
Page 97: ...Issue 1 1 April 2006 Page 96 Figure 59 Spectrum Management Help Page ...
Page 162: ...Issue 1 1 April 2006 Page 161 Figure A8 Surge Arrestor ALPU ORT Connection Illustration ...


