Device Main Window
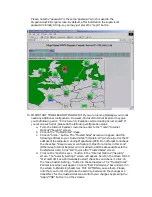
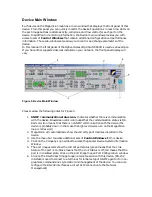
Each device on the MegaVision map has a main window that displays the front panel of that
device. From this panel you can quickly monitor the device’s operations in real time. LEDs on
the port image buttons indicate activity, collisions, and flow control for each port on the
device. In addition to monitoring information, the Device main window provides you with
access to sets of
Control Windows
that contain additional configuration and performance
information. These sub-windows also allow you to control and change parameters of the
device.
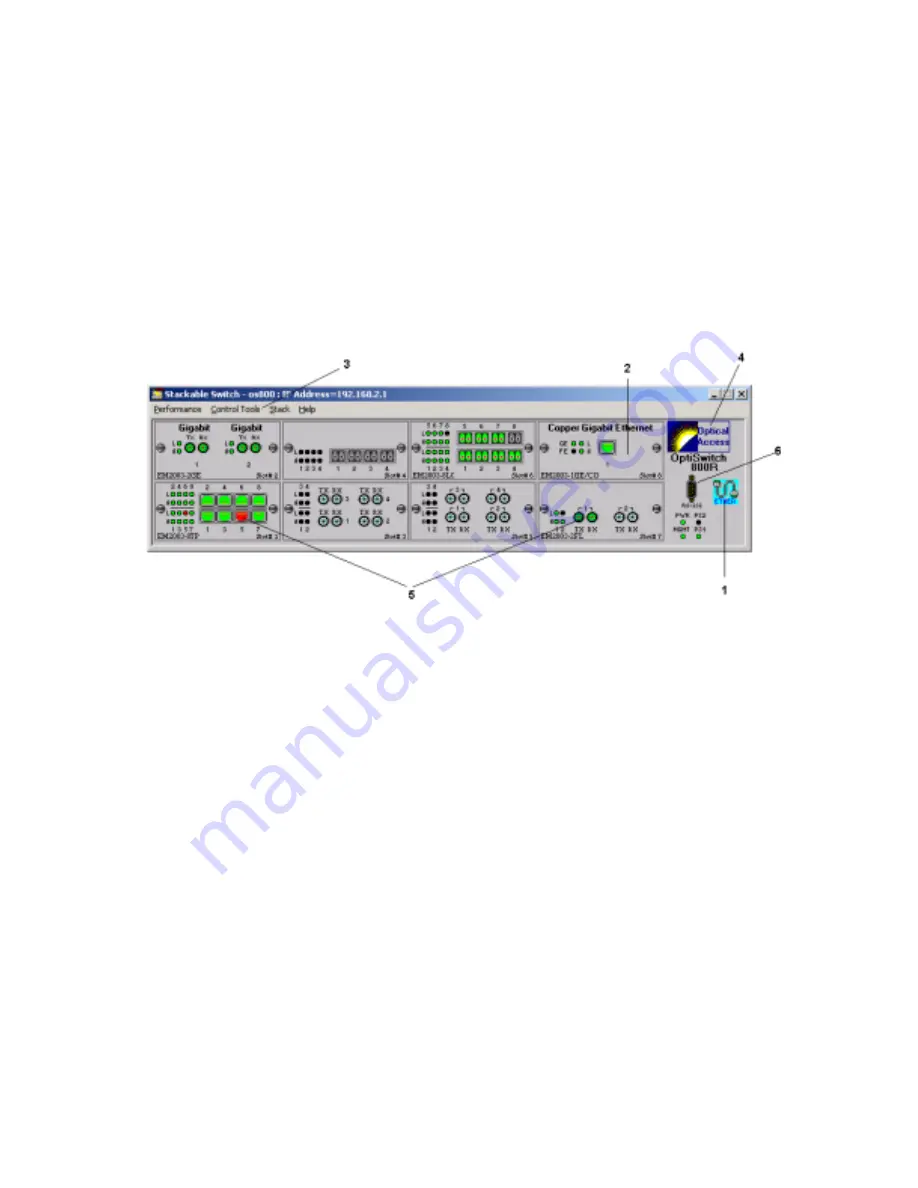
In this manual the front panel of the Optical Access OptiSwitch 800R is used as an example.
If you have other supported devices installed on your network, the front panel display will
vary.
Figure 5. Device Main Window
Please review the following notes for Figure 5.
1.
SNMP
C
ommunication status icon.
Indicates whether there is communication
with the device. Blue/Green color icon means that the communication status is OK.
Red color icon means that there is no SNMP communication with the device (the
device is probably down: in that case the high level device icon on the MegaVision
map is red as well)
2.
MegaVision will automatically show the correct type of modules installed in the
device.
3.
Use the menu bar to access additional sets of
Control Windows
for this device.
4.
Click on the Company Logo symbol to access the general Device System information
Window.
5.
The port images color show the current port status (green means that the Link
Status of the port is on; black means that the Link Status is off; red means that the
port is in disabled state. Click on the port image to open Port Configuration window.
6.
Click on the RS-232 port image to open a telnet session with this device. (RS-232
interface is used to connect to a terminal for initial setup of SNMP agent or for non-
graphical, command-line style control and management of the device. You can also
configure the RS-232 interface as a direct SLIP connection to the Network
Management)

