USB-5100 Series Software Help
Reading Out, Plotting, and Analyzing Data
29
events can include started or stopped logging, low battery, or an alarm trip. Refer to the logger manual for a
complete list of internal events if applicable.
5.
Adjust the time zone offset, if necessary. By default, data is shown in the offset used to launch the logger
with USB-5100 Series . To select a different offset, enter the hours offset from GMT (UTC) in decimal
form. You may find this useful if you logged in multiple time zones, or if you took the logger to a different
time zone after launching it.
6.
Click
Plot
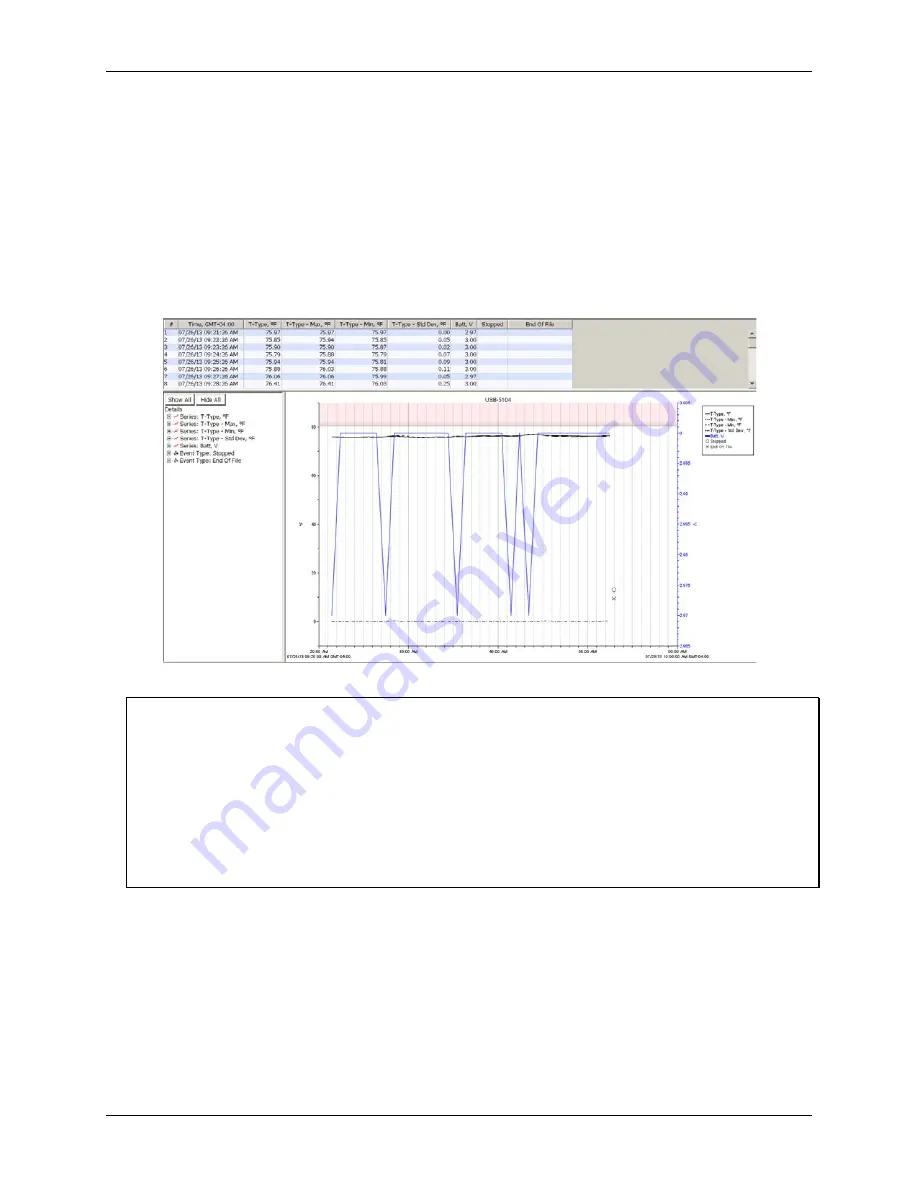
to generate a plot. The plot is drawn and includes a title, a time axis (x-axis), one or more value
axes (y-axis), and a legend. The data for each series are listed in a points table above the plot. Details about
each series, such as the type of logger and deployment information are listed in the Details pane to the left
of the plot. You can show or hide these elements using the
menu. To organize several plots, use the
Window menu to switch between Tabbed View, Tile Horizontally, or Tile Vertically.
Figure 14. Plotted Data
Notes
To change the order of series displayed in the Plot Setup dialog box, select
File»Preferences»Display»Series
.
To change the series and events that are selected by default in the
Plot Setup
dialog box, select
File»Preferences»Plotting»Plot Setup
.
Started and Stopped internal events can occur multiple times in a single deployment (as configured in the
dialog box). Multiple stopped and started events in a single file are not only displayed on the
plot if selected in the Plot Setup dialog box, but the resulting gap that occurs in the data is also represented in
the series. In this example, the logger was stopped at 1:19 and then started again at 2:35; both events are on the
plot. The temperature series shows a break between those two times. That represents the gap between when
logging was stopped and when it resumed, both using the button on the logger.


