Trawl Explorer | V7 | System Configuration and Display
becomes lower than 20 meters (
1
). This way, the echogram displays better quality images when
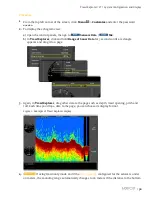
the distance to the bottom is shorter. Echogram images will be displayed like the example
below:
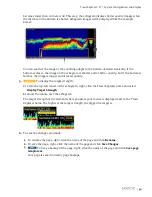
You can see that the range of the sounding adapts to the bottom detected. Basically, if the
bottom is closer, the image on the echogram is shorter and of better quality, but if the bottom is
farther, the image is longer and of lesser quality.
5.
To display the target strength:
a)
From the top left corner of the echogram, right-click the Trawl Explorer name and select
Display Target Strength
.
b)
Hover the mouse over the echogram.
The target strength of the element where you place your mouse is displayed next to the Trawl
Explorer name. The higher is the target strength, the bigger the target is.
6.
To save the changes you made:
1.
To rename the page, right-click the name of the page and click
Rename
.
2.
To save the page, right-click the name of the page and click
Save Changes
.
3.
To have a backup of the page, right-click the name of the page and click
Save page
template as
.
Your page is saved in Scala's page backups.
|
39
Summary of Contents for NBTE V1
Page 1: ...Trawl Explorer User Guide...
Page 2: ......

