SkyRaider DS10CTEC User Manual
March 17, 2019
SkyRaider DS10CTEC User Manual
Page 84
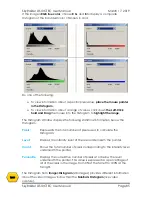
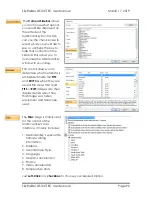
Histogram
A
Histogram
illustrates how
pixels in an image are
distributed by graphing the
number of pixels at each
color intensity level. The
Histogram
shows detail in
the shadows (shown in the
left part of the histogram),
mid-tones (shown in the
middle), and highlights
(shown in the right part).
A
Histogram
can help you
determine whether an
image has enough detail to
make a good correction.
A histogram is a mathematical graph that shows you the current
tonal range
of
an
image
. This way you can evaluate it and, if necessary, correct it.
Tonal range
refers to the range of brightness levels in the image. A histogram
shows us how much of the image is currently pure black, how much is currently
pure white, and how much of it falls somewhere in between.
It is very important to note that even though we're talking about brightness
levels, we're
not
just talking about black and white (grayscale) images, but
Histograms work equally well, and are just as important, with full color images.
This is because, even though we don't always think of color as being anything
but color; yet every color in your image has its own brightness level.
Orange, for example, are typically very light; while blues and reds are much
darker. These differences in brightness values mean that color can have a huge
impact on the tonal range of your image.
Do a Google Search on
How to Read and Understand Image Histograms in
Photoshop
to find out more information on how to use Histograms to improve
your images.
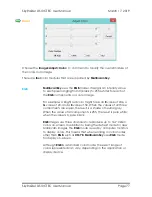
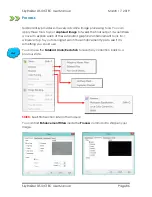
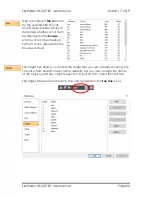
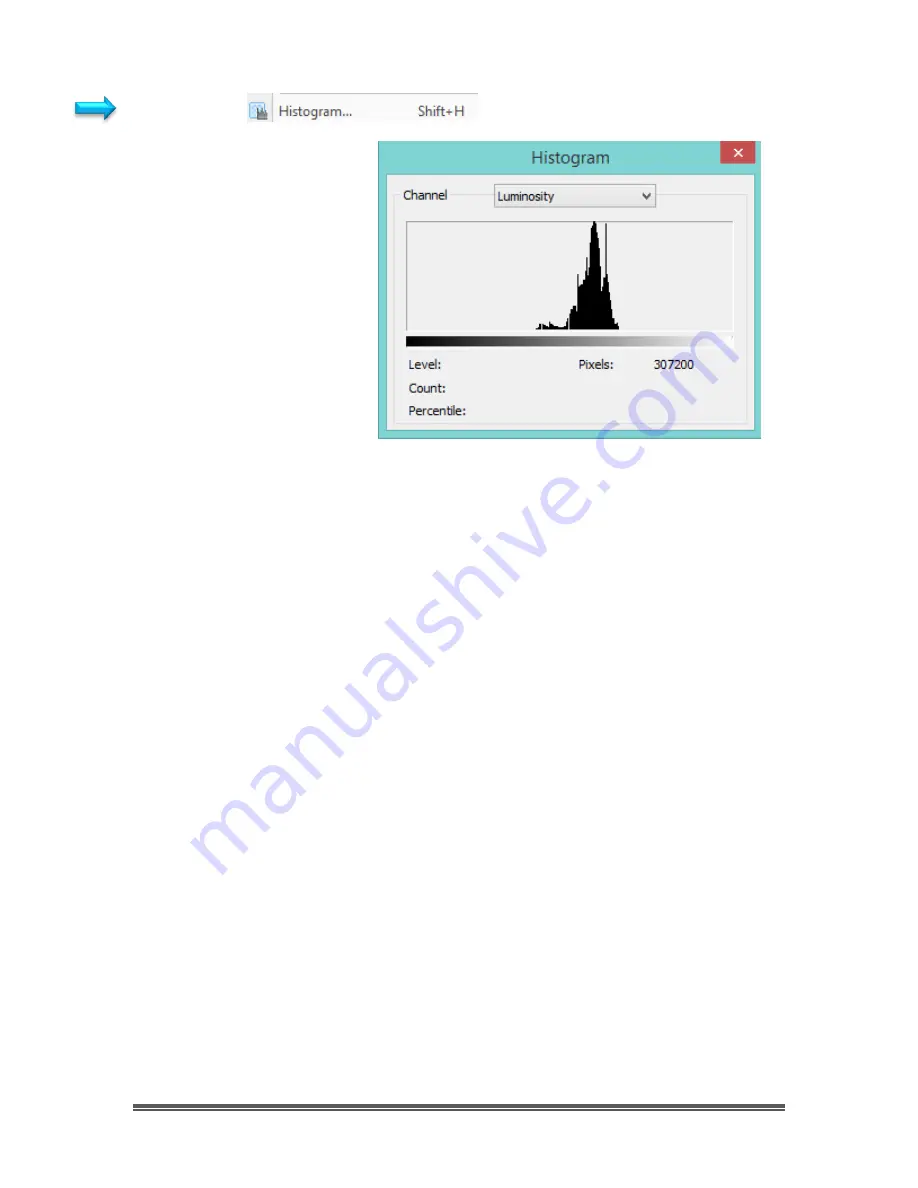
Choose the
Image>Histogram•••
command to open the
Histogram Window
.
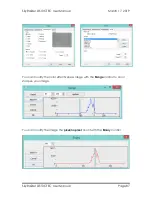
Depending on the image’s color mode, choose
R
,
G
and
B
, or
Luminosity
to view
a composite Histogram of all the channels.
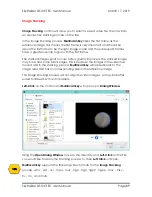
If the image is
RGB true color
, choose
Luminosity
to display a Histogram
representing the luminance or intensity values of the composite channel.


