MS-TestPro USER GUIDE
19
|
www.m4sol.com
HDBaseT Performance Testing
Reading the Performance graphs:
With any data being passed over a CATx cable, the idea is to have adequate headroom in
the cable to allow for fluctuations or increases in data.
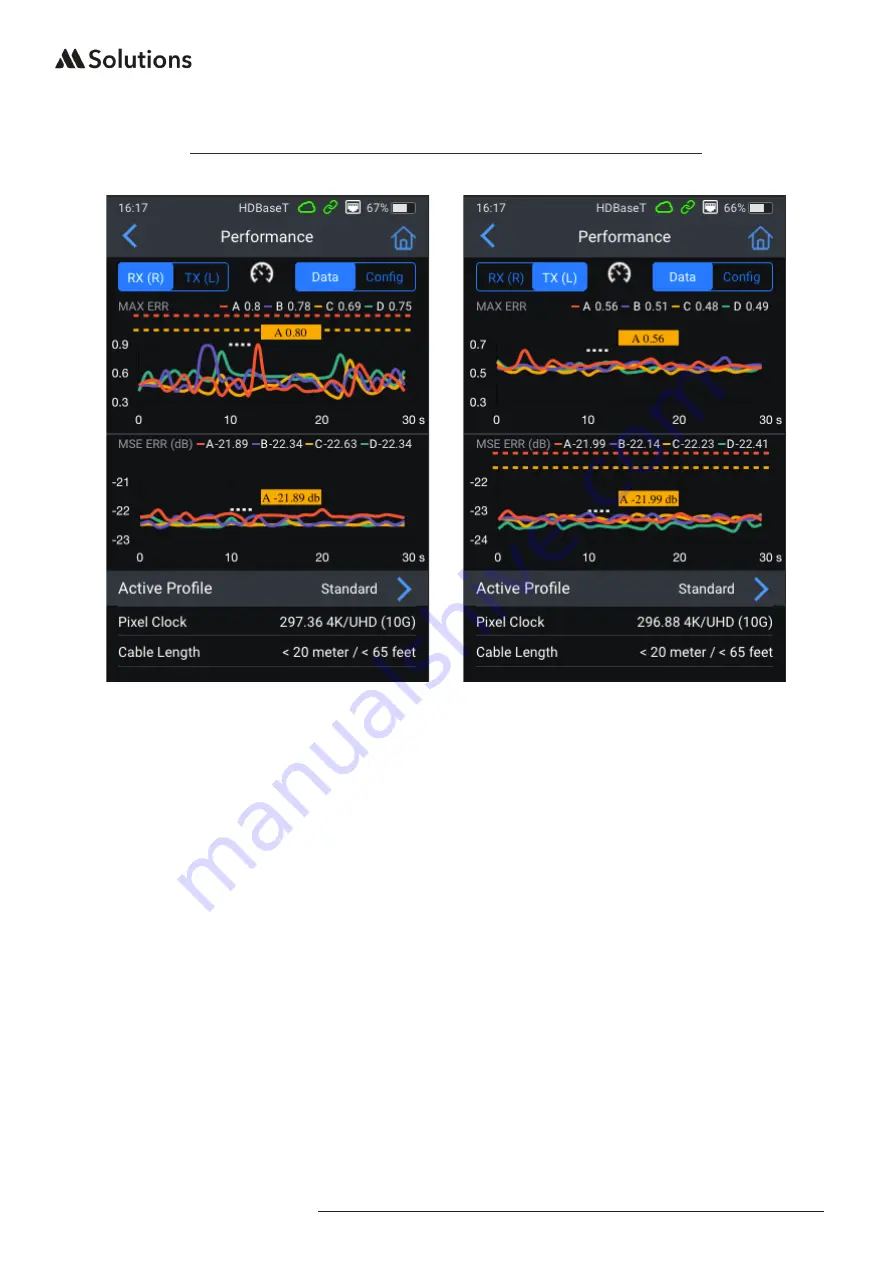
The performance graphs show the individual twisted pairs data performance. Some points
to note as follows when viewing the live output of the performance:
• The 4 twisted pairs should all be similar in their performance across the graph. Should
any of the coloured lines be noticably different (higher, on average) than the rest, this
indicates that there could be a fault on these specific pins.
• The coloured lines should have some headroom underneath the orange dotted line for
optimal perfomance.
• The closer the twisted pair lines are to the orange dotted line on the MSE ERR, the more
resistance they are encountering. This could be due to the overall length of the cable - in
the above example the length of the cable is 92m - this is nearing the limit of HDBaseT’s
overall extension capabilities. However, if the length is being reported at 25m (as an
example), this would therefore be an example of poor quality cable, or, that the cable is
being subjected to resistance from in-line connections (i.e. patch panels, wall plates or
inline connectors) - removal of these ‘joins’ will increase the quality of the signal and
reduce the MSE ERR.


