


SR1 Operation
205
© 2014 Stanford Research Systems
2.5.3
Digitizer Display
The digitizer display is designed to display the measurements calculated by SR1's optional
Digitizer
.
Unlike the
Graph
, which can display many different traces corresponding to user-selected
measurements, the 4 tabs of the Digitizer Display always display the same digitizer measurements.
Each digitizer display can be "live", meaning that it is updated each time a new digitizer record is
acquired, or it can be "offline" meaning that the displayed measurement results are not updated. Offline
Digitizer Displays can be useful for displaying reference data for comparison with live data.
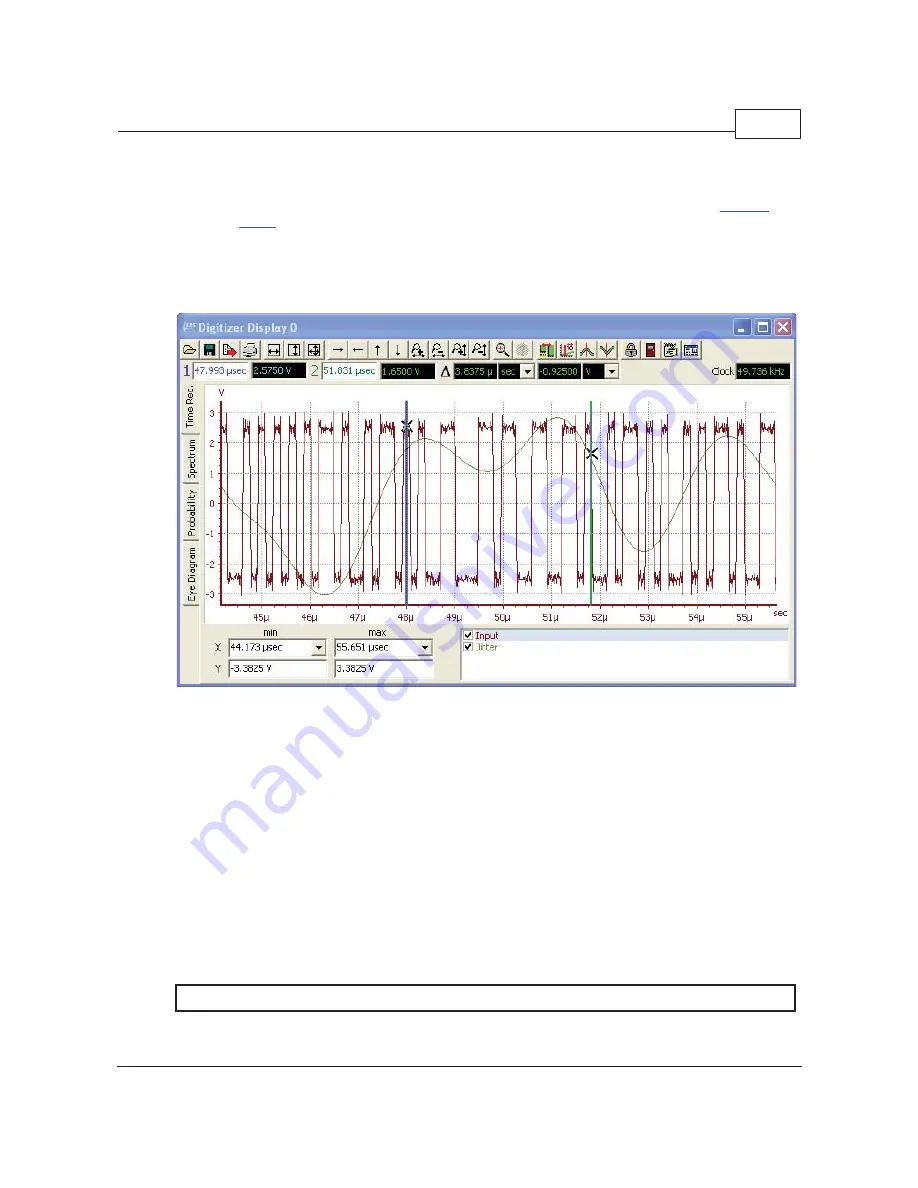
The digitizer display has a similar layout to the Graph. At the top of the display is a speedbar with
buttons corresponding to frequently used functions. Below that is a cursor bar with readouts for the two
cursors. The calculated effective digital audio sampling frequency is shown at the right-hand edge of the
cursor bar. The central portion of the display is a tab-control with 4 tabs each of which displays a
different set of digitizer measurements. The "Time Rec." tab show the two measurements which are
functions of time: Input Amplitude and Jitter Amplitude. The "Spectrum" tab displays the spectrum of the
input signal and the jitter. The "Probability" tab shows amplitude histograms of the input and jitter
amplitudes as well as the distribution of pulse widths and pulse rates in the digitizer record. Finally the
eye diagram displays probability vs. amplitude and time using a color-coded 2-dimensional plot.
Note that all the traces in a digitizer display reflect measurements computed from the same underlying
digitizer record. Therefore, traces may not be copied and pasted between digitizer displays as they may
be on the normal graph.
Digitizer Display Speedbar
The speedbar at the top of the Digitizer Display provides quick access to the following functions:
Graph Speed Bar Functions
Summary of Contents for SR1
Page 5: ...Part I Getting Started Audio...
Page 7: ...Getting Started 7 2014 Stanford Research Systems...
Page 12: ...SR1 Operation Manual 12 2014 Stanford Research Systems...
Page 27: ...Part II SR1 Operation Audio...
Page 258: ...SR1 Operation Manual 258 2014 Stanford Research Systems...
Page 272: ...SR1 Operation Manual 272 2014 Stanford Research Systems on the amplitude sweep...
Page 289: ...SR1 Operation 289 2014 Stanford Research Systems...
Page 290: ...Part III SR1 Reference Audio...