p. 76
The speed graph plots two parameters: aircraft speed (red) and a reference speed (Vref)
(green).
The following data readouts and buttons are displayed in the plot toolbar area (directly below
the Page Navigation Toolbar):
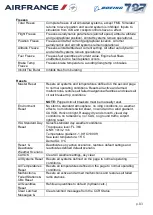
Elevation
Rwy Cond
Gusting To
C/L Dev
This is the current deviation distance in dots from the active runway centre line. It
is always calculated, irrespective of the aircraft's position.
G/S Dev
This is the current deviation distance in dots from the active runway glideslope
beam centreline (or virtual glideslope if non-GS equipped). It is always calculated,
irrespective of aircraft position.
Max C/L Dev
This is the maximum localiser deviation from the active runway. It is always
calculated, irrespective of the aircraft's position.
Max G/S Dev
This is the maximum glideslope deviation from the active runway. It is always
calculated, irrespective of the aircraft's position.
TCH
This is the height at which the aircraft crosses the runway threshold as it flies down
the ILS glideslope.
T/D Dist
This is the point to point distance from the aircraft to the active runway touchdown
zone. This touchdown zone is represented on most runways as 2 large white
blocks either side of the runway centreline, approximately 1000ft from the runway
threshold.
T/D ROD
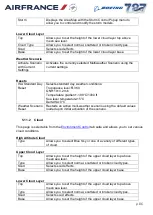
Erase Track
Erases the current plot.
Scale
Allows you to change the scale of the plot (auto, high, medium,
low).
5.8.2
Runway
This page is selectable from the
tab suite and consists of four graphs:
A/C Position (aircraft position on the runway; Y axis scale is dependent on runway
width, X axis scale is dependent on runway length)
Brakes (left and right pedal deflection; Y axis scale is 0 to100 %, X axis scale is
dependent on runway length
Speed (aircraft speed; Y axis scale is 0 to 200 kt, X axis scale is dependent on
runway length)
Rudder Pedals (deflection left (negative) and right (positive) in degrees; Y axis
scale is -20º to +20º, X axis scale is dependent on runway length)

