45
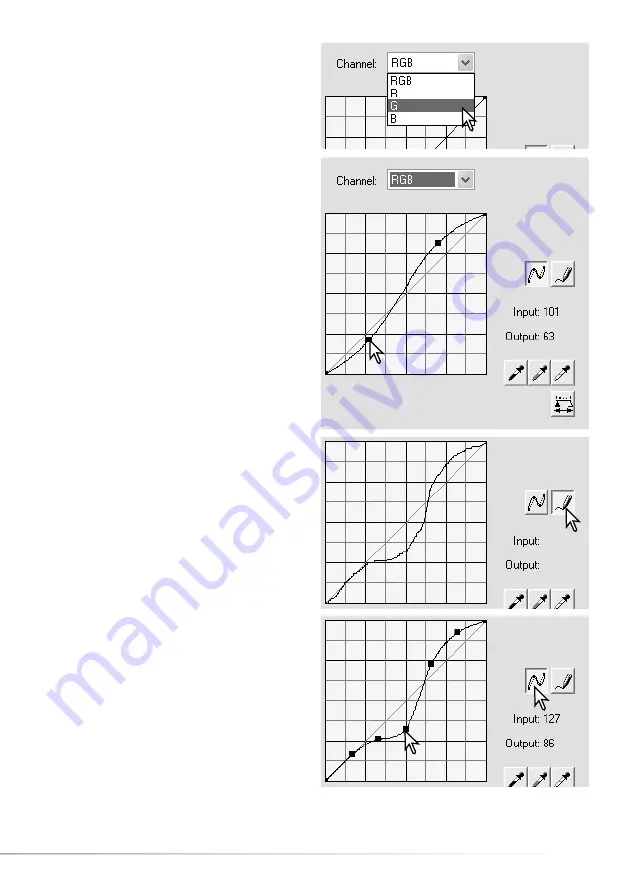
Place the mouse pointer over the tone curve.
Click and drag the curve.
Each time the tone curve is clicked, a new node
is attached. The nodes can be moved by
clicking and dragging. The input and output
levels of the node are displayed as it is moved.
The input level (horizontal axis) refers to the
original image, and the output level (vertical axis)
refers to the new value in the adjusted image.
Any corrections made on the tone curve are
immediately applied to the displayed image. By
placing the mouse pointer on the image, the
gray or color level of that point is indicated on
the tone curve by a white circle.
Click the arrow next to the channel list box to
select the channel. To make adjustments to the
color balance of the image, select the
appropriate color channel. To adjust the contrast
or brightness of the image without affecting the
color, select the RGB channel.
To draw a tone curve, click the freehand-curve
button. The mouse pointer changes to the pencil
tool when placed in the tone-curve box.
Click and drag the pointer to draw a new curve.
Extreme image manipulations are possible with
the freehand curve tool.
To smooth a rough freehand curve, click the
smooth-curve button. Nodes are automatically
placed on the curve and can be adjusted with
the mouse.
With extreme freehand curves, the smooth curve
button may significantly change the shape of the
curve. The reset button cancels all corrections in
all channels.
Summary of Contents for DiMAGE Master Lite
Page 1: ...INSTRUCTION MANUAL ...


