14
14
Transparent
Adjust the transparency of the level meter display against the image.
Off, Background, All
Peak Hold
Activates/deactivates the peak hold function of the level meter.
Off, On
Lissajous Setting
Lissajous setting
<Lissajous display example>
H Axis Channel(X)
Select an EMBEDDED AUDIO CH to display on the horizontal axis of the Lissajous screen.
1, 2, 3, 4, 5, 6, 7, 8, 9, 10, 11,
12, 13, 14, 15, 16
V Axis Channel(Y)
Select the EMBEDDED AUDIO CH to display on the vertical axis of the Lissajous screen.
1, 2, 3, 4, 5, 6, 7, 8, 9, 10, 11,
12, 13, 14, 15, 16
Position
Select a position to display the screen.
Lower Right, Lower Left,
Upper Left, Upper Right
Transparent
Set the background of the screen to translucent.
Off, On
Gain
Specify the Lissajous gain.
0dB, +6dB, +12dB
Audio Delay
Audio delay setting
Delay
Delay EMBEDDED AUDIO of SDI input.
0, 1, 2, 3, 4, 5, 6, 7, 8, 9, 10
*
1
Operates as SDI-1 during Dual Link input.
*
2
Memorized for each input.
Scope Setting*
1
Configure the settings for the wave form monitor, vector scope and histogram.
Item
To do
Setting value
Gain*
2
Adjust the input gain level.
–10 to +10
Size*
3
Set the window size.
Normal, Large
Position
Select the window position.
Lower Right, Lower Left
Upper Left, Upper Right
Transparent
Activates/deactivates the function to make the window translucent.
Off, On
Off
On
:
:
Normal
Translucent
Auto Off
Set the function to turn off the window automatically 15 minutes after displayed.
Off, On
Histogram Display
Select the signal component for the histogram display.
Y, R, G, B, RGB
Wave Display
Select a wave form to be displayed for the wave form monitor.
Y, Pb, Pr (HD signal)
Y, Cb, Cr (SD signal)
R, G, B (RGB signal)
Wave Filter
Turn on/off the lowpass filter to put over the input wave form data.
Flat (No filter)
Low pass
Wave Over Level Marking
Turn on/off the function to change the wave form color of signals over the value specified in
“Wave Over Level”. (
+
below)
Off, On
Wave Over Level
Adjust the lower limit for the over level.
70 – 109
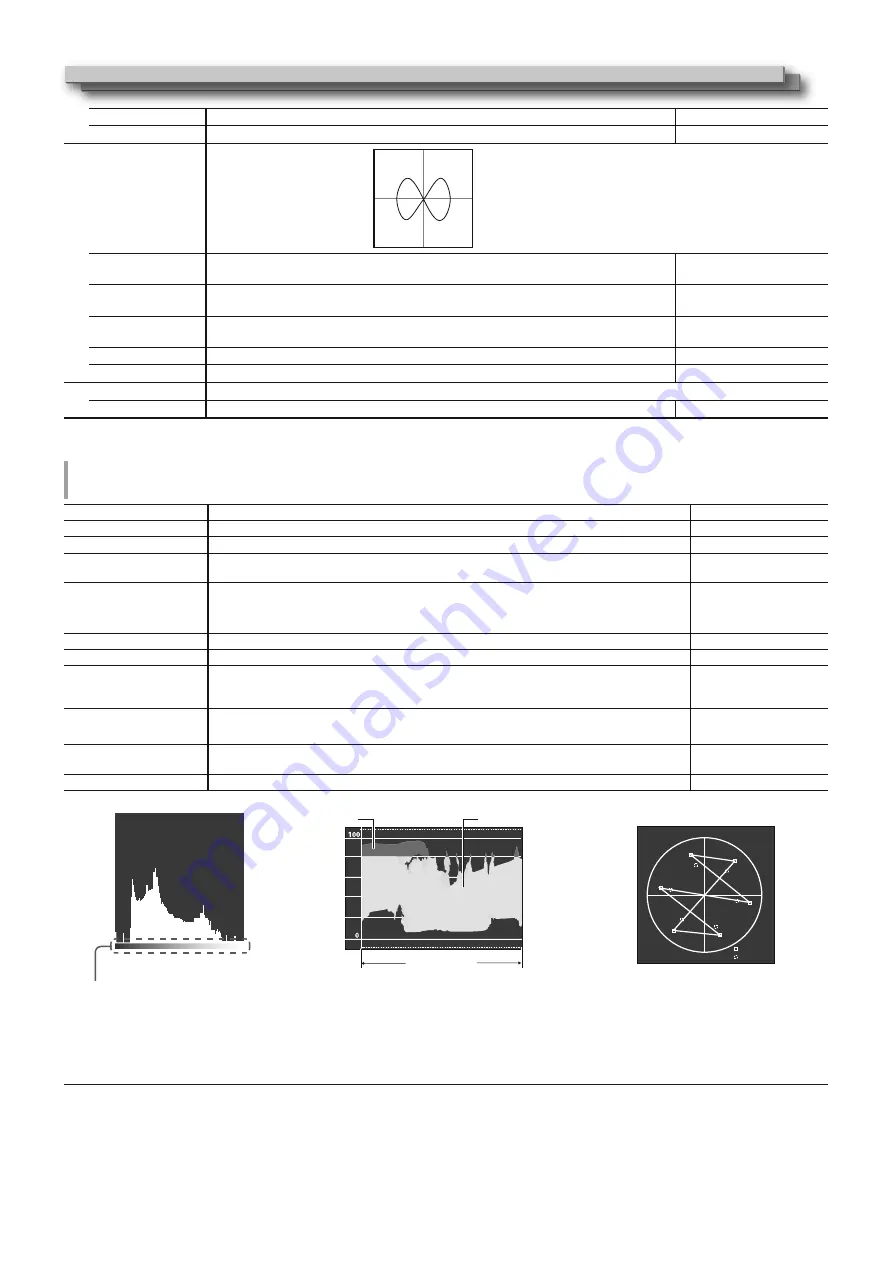
<Example of the histogram display>
<Example of the wave form monitor>
<Example of the vector scope>
<dark
brightness
light >
Pixels
Image signals
Start
End
Red
White
Y
Mg
R
B
100% level
75% level
Cy
G
Yl
The start and the end of the gradient
correspond to 0% and 100% of the signal.
Ex.: When the luminance signal is Y, “Wave Over
Level Marking” is set to “On” and “Wave Over
Level” is set to “80”
t 5IFXBWFGPSNDPMPSPGTJHOBMTPWFSUIFWBMVF
specified in “Wave Over Level” turns red.
t 5IFEJTQMBZEJGGFSTEFQFOEJOHPOUIFJOQVU
signal or the “Wave Display” setting.
Ex.: When the color bar is displayed
*
1
The vector scope is not displayed when the input signals are RGB.
*
2
Unavailable for the histogram.
*
3
The size of the histogram can only be “Normal.”
Y
X
Menu Configuration (cont.)
'79*B(1LQGE


