


Chapter 5 Reflection Testing
CellAdvisor JD720C Series User
’s Manual
51
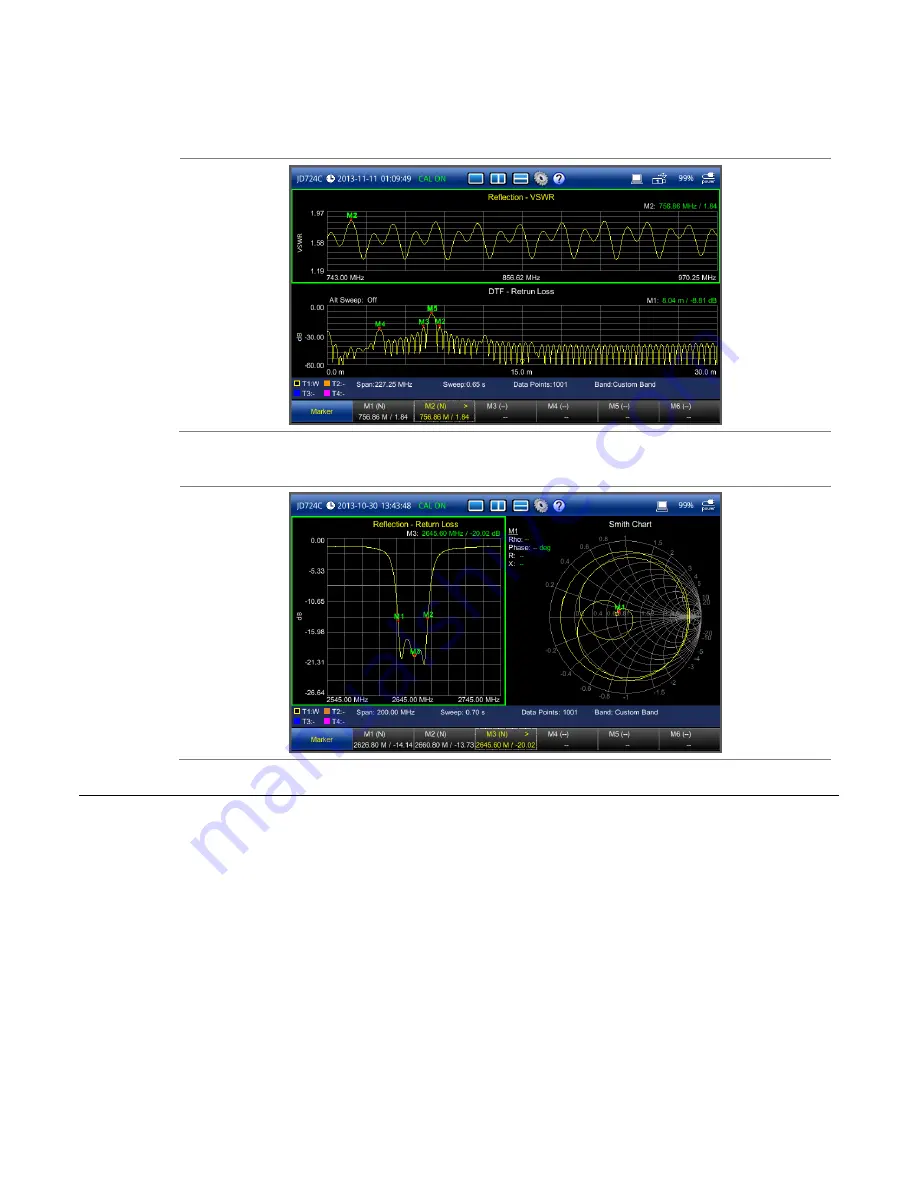
Figure 22
Reflection VSWR & DTF return loss measurement screen (horizontal layout)
Figure 23
Reflection return loss & smith chart measurement screen (vertical layout)
Analyzing measurement results
You can use the Marker, Peak, Trace, Limit, Hold and Auto Scale hard keys and Zoom Zone
function for your analysis of the results. You can also use Favorite, Quick Save and
Save/Load functions. See "Analysis" on page 125 and
“Operation” on page 138 for details.


