Page 18
Engine Data Management
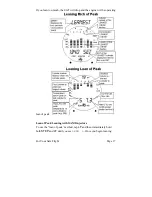
(flashing dot) you cannot change leaning methods. You may toggle back
to
LEAN R
by holding both buttons again.
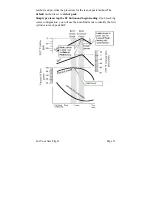
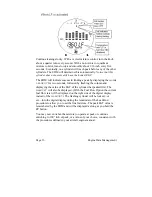
In the “lean of peak” method the columns will
invert
with the first to
peak progressing down from the top of the display. The inverted column
scale is
5° per segment
below peak. As you continue to lean past peak
the dot of the each successive cylinder will flash as it peaks. The peaks
will be shown as an
inverted bar graph;
when the last cylinder peaks its
column will flash. The analog display is an inverted bar graph showing
where each cylinder peaked. When the LF button is held the display will
show the delta fuel flow between the first and last to peak (GAMI
Spread), as well as the richest peak EGT.
Turbocharged Engines
The leaning process for turbocharged engines is by reference to the first
cylinder or TIT to reach peak. However, the TIT
factory red line
may
limit the leaning process. TIT red line is generally 1650°F, and up to
1750°F in some installations. In the LeanFind mode the T
column—TIT—is included in the procedure. If during leaning the TIT
exceeds red line by less than 100° for less than one minute, the LeanFind
procedure will continue to operate, allowing you to complete the leaning
process. Otherwise the digital display will show, for example,
I650
TIT
and
TIT
will flash. You will notice that in some cases the TIT reads
100°F hotter than the hottest EGT
. This is caused by unburned fuel in
the exhaust and igniting.
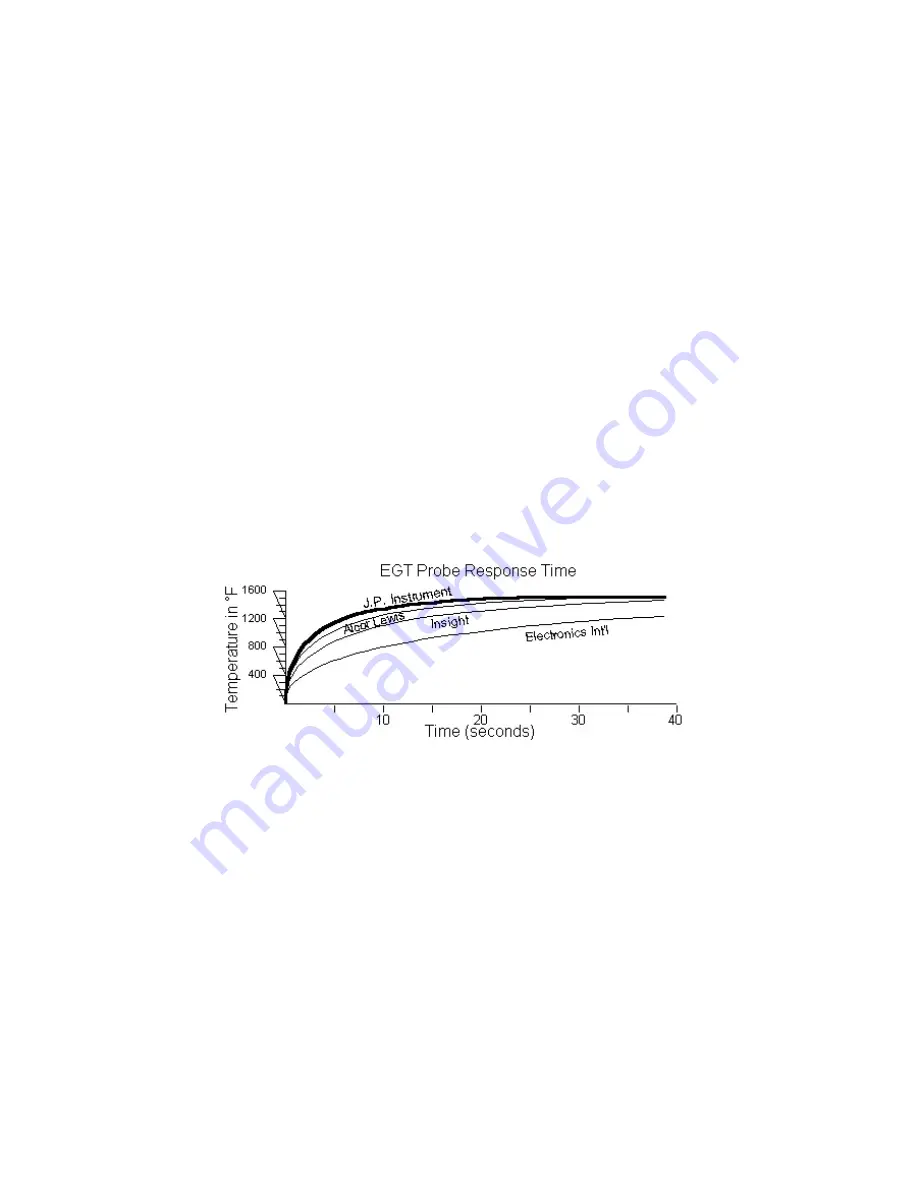
The reduced size of the
JPI
Hastaloy-X-tip probes produces faster
response
and more accurate than the massive factory installed probe.
Therefore
JPI
probes may read as much as 100°F higher than the
factory installed probe. However, note that the engine was certified with


