background image

Geophysical Survey Systems, Inc. 

SIR® 20 


Manual 


MN92-078 Rev F 

55 

After Collection 

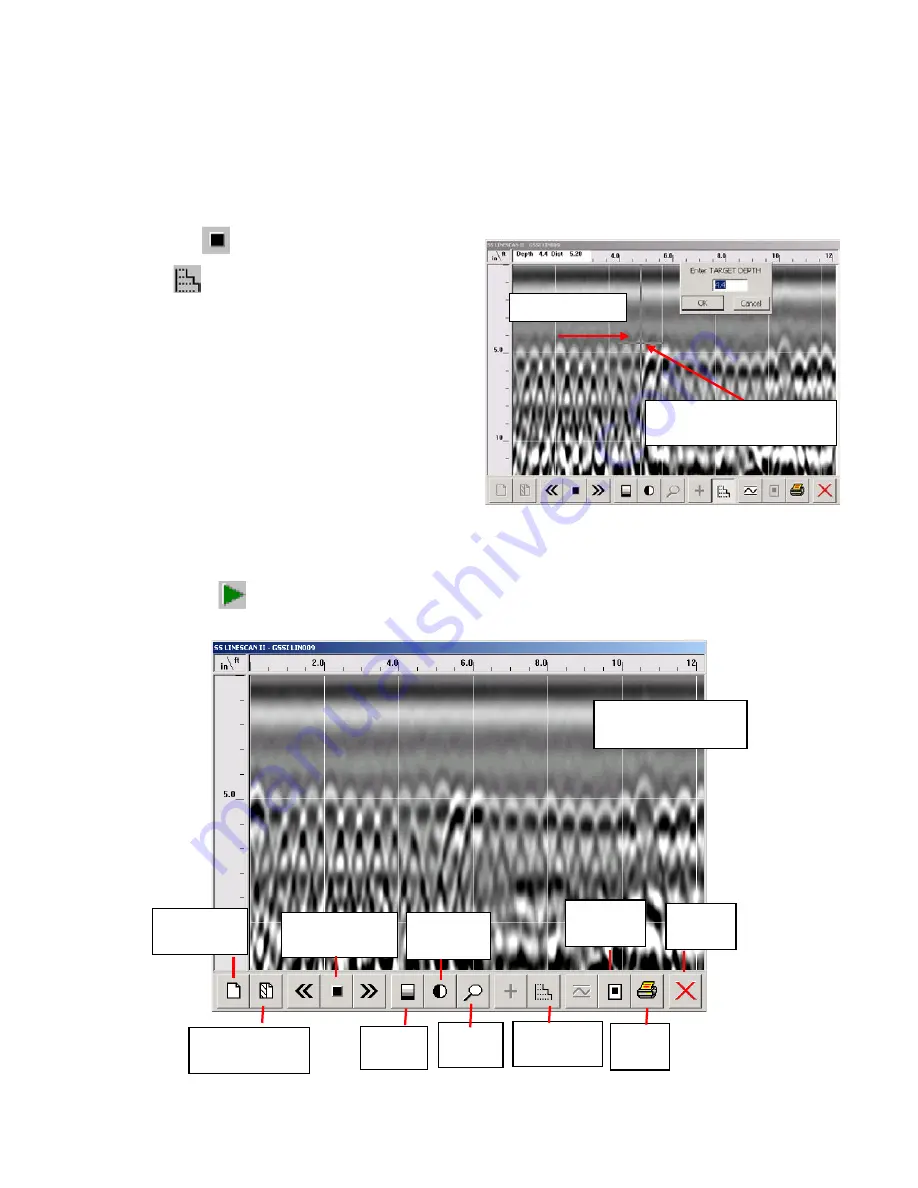
The depth scale can be calibrated using a known target. If the depth of a visible target is known (slab 
thickness, rebar depth): 

If setting depth on file being collected: 

1


Close file 

2


Press 

 (F8). 

3


Place cursor over the exact point with known 
depth and click left mouse button. 

4


A crosshair is inserted on the position selected. 

5


Enter known target depth in the prompt window. 
The depth scale will be recalculated and the screen 
display scale adjusted. 

6


Depth can be set in Playback mode using the same 
steps. 

Playback 

You can also 

Playback

 data that you have previous collected and saved. Files can be recalled using the 

Playback button 

 (F6) on the opening page of StructureScan Linescan. You will see a listing of all of 

your saved data files.  


Known target  

Crosshair over target 

with known depth 

Figure 56: Set Depth. 

         Scroll  
        Lft   rt  

Open File 

F2 

Open 2

nd

 File 

F3 

Zoom 

F6 

Contrast 

F5 

Colors 

F4 

Set 

Depth 


File Info 

F10 

Print 

F11 

Exit 

ESC 

During Playback 

Figure 57: Playback Options. 

Summary of Contents for SIR 20

Page 1: ......

Page 2: ...luding the right of reproduction in whole or in part in any form Published by Geophysical Survey Systems Inc 40 Simon Street Nashua New Hampshire 03060 3075 USA Printed in the United States SIR RADAN and UtilityScan are registered trademarks of Geophysical Survey Systems Inc ...

Page 3: ...ubject to the following two conditions 1 this device may not cause harmful interference and 2 this device must accept any interference received including interference that may cause undesired operation Warning Changes or modifications to this unit not expressly approved by the party responsible for compliance could void the user s authority to operate the equipment Note This equipment has been tes...

Page 4: ......

Page 5: ...Data Collection 27 Tips for Grid Setup 27 The Three Collection Methods 28 Setup for Fixed 3D Grid 28 Setup for Survey Belt 35 Setup for Survey Wheel 42 Chapter 4 Information for StructureScan Users 51 SS Linescan 51 StructureScan 57 Structure Scan Optical Optical Scan 62 C Scan Display of Data and Joining Grids 65 Chapter 5 Using a GPS with your SIR 20 67 Attaching a GPS 67 Understanding GPS 68 Us...

Page 6: ......

Page 7: ...ur shipment that identifies all of the items that are in your order You should check your shipment against the packing list upon receipt of your shipment If you find an item is missing or was damaged during the shipment please call or fax your sales representative immediately so that we can correct the problem You may have purchased your SIR 20 as part of a pre configured system If you have purcha...

Page 8: ...note the different external features Figure 1 Major external features May vary depending on Toughbook model The SIR 20 is designed to be used in a variety of field configurations While it is often preferable to leave the laptop attached to the system as one whole unit you may sometime wish to separate the computer and the MF 20 control box You will first need to loosen the thumbscrews on the front...

Page 9: ...igure 2 Connectors under network cable shield The laptop s USB port can be accessed opening the protective door at the back of the laptop The connector panel on the back of the MF 20 is detailed below Figure 3 MF 20 connector panel 1 This port accepts the connector from the Smart Lead Acid battery part FGMOD1218S3 The metal clip is designed to fit over the battery connector and ensure a tight conn...

Page 10: ...o check the 15 amp fuse 6 Marker connector This is a 2 pin connector used to attach a remote marker trigger to the system The marker trigger would be used to indicate points of interest in the data 7 Survey wheel connector This is a 4 pin connector used to attach a survey wheel or DMI distance measuring instrument If you are using your SIR 20 for a pavement mapping application this is where you wi...

Page 11: ...emove your SIR 20 from the transit case and place on a flat surface Allow for some airflow around the cooling fan on the side of the MF 20 2 Connect your antenna to the SIR 20 with a control cable Ensure that the connection is hand tight 3 If you are using a survey wheel connect the survey wheel lead to the survey port on your antenna housing 4 Connect your SIR 20 to your power source 5 Turn on th...

Page 12: ...Geophysical Survey Systems Inc SIR 20 Manual MN92 078 Rev F 6 ...

Page 13: ...cessing package RADAN Figure 5 SIR 20 Desktop with StructureScan Icons You will see five additional shortcuts with a GPR profile outline RADAN SIR 20 SS Linescan Structure Scan and Optical Scan RADAN is only for data processing The other four open separate data collection programs SS Linescan Structure Scan and Optical Scan are specifically designed for shallow scanning of concrete structures with...

Page 14: ... a window showing any disk drives that you have installed 3 Find the Hard Disk Drives section and double click Local Disk C This will open a window showing all of the folders that you have stored You will see six choices at the top of the screen They say File Edit View Favorites Tools Help Click on File 4 Move the arrow down to New and then over to Folder Click on Folder You will see that Windows ...

Page 15: ...ize options 2 Make sure that there is a check next to the Status Bar If not move the arrow down to highlight it and click on it 3 Next click Customize You will see a window with four tabs at the top Figure 7 Customize window 4 Directories Set working directories Click the Source button You will see a window pop up with a list of folders that are on your computer If you type in a new complete path ...

Page 16: ...e main file types that are important in 2D data collection Project Data and Macro files As you create these different file types try to keep a notebook with their names and your job information That way you will know what all of these file types mean when you go to review your work All of these files will be stored in the folder that you created in the previous section Project Files have the exten...

Page 17: ... project file and TEST CMF macro to the master project file You can rename it at this point if you wish but make sure both files have exactly the same name 3 When you wish to use the master project open the SIR 20 collection program and click the Run Master Project icon located at the bottom left of the screen 4 Enter in a new name if you wish The data files will be saved to the working directory ...

Page 18: ...ge Scans unit will be English Imperial or Metric units depending on what linear units you selected in View Customize Collection Parameters Figure 9 The Configuration Window Your SIR 20 can be used for many different applications Because of this you should have a full understanding of how different configuration settings should be applied to each type of survey You will see the Configuration Window...

Page 19: ...Samp Scan The default sample per scan setting is 512 This is the number of samples per scan that the SIR 20 will use to digitize the trace This number must be greater than 10 times range antenna pulse width to avoid aliasing Antenna pulse widths are listed in the antenna setup section at the back of this manual Sampling densities available are 128 256 512 1024 and 2048 5 Scans Sec This is the numb...

Page 20: ...0 runs an algorithm on the received signal and decides how much gain amplification to apply to the signal The auto gain level defines how strong the gained signal should be relative to the recordable dynamic range 32767 for 16 bit data A value of 0 5 means that the strongest gained sample in any given gain segment will be 50 of the total dynamic range If you believe that you have targets or reflec...

Page 21: ...ntenna over your survey surface at a constant rate If you collect free run data you should lay out a tape measure along your survey line and click your marker button whenever you antenna passes a measured grid point e g every 5 feet This will allow you to determine the approximate location of reflectors in your data You can perform distance normalization in RADAN on this type of data later to conv...

Page 22: ...a new window with the heading Review Project Information Figure 11 Figure 11 Project Information dialog box 3 Enter information to describe your project area You can give the project a Title Start Finish time and add Notes Note the gray button for Output Path This is the location where the SIR 20 will store your data files This location was set by you in View Customize All data entry on this scree...

Page 23: ...vey Wheel Calibration Figure 13 This is where you enable the specific survey wheel device you are using with the SIR 20 and determine how many internal ticks per selected unit of distance Figure 13 Survey Wheel Calibration dialog box If you have a StructureScan minicart click on the image of the cart that you have If you have an Optical cart click the image of the blue minicart If you have a diffe...

Page 24: ...more scans per unit that you collect the slower your collection speed the larger your data file and the more stretched your file will appear When you are finished click Next 8 The next window Figure 15 will ask you to either create a new macro or attach one that you have already created A macro is nothing more than a saved list of data collection parameters These parameters include filters time ra...

Page 25: ...ction control enable the user to adjust the direct coupling pulse i e the transmitted pulse of the antenna to zero time or to adjust the direct coupling pulse up or down in the selected time range window You will note that with the auto position servo ON the transmitted pulse is set several nanoseconds below the top of the O scope display The Auto Position Servo automatically sets the transmitted ...

Page 26: ... depth Each successive gain point should be greater than or equal to the previous Be careful not to apply too much gain This will lead to a phenomenon known as clipping Clipping will limit the data and will cause you to lose valuable information and make it much more difficult to identify targets in the data In addition RADAN functions such as vertical and horizontal filtering FFT filtering Spectr...

Page 27: ... button on the collection toolbar You can also close and save automatically the file by holding down the antenna tow handle marker button for 5 seconds To collect another profile with the same settings click the Run Project button green square Time Based Free Run Continuous Data Collection The setup procedure for a time based collection is very similar to a survey wheel controlled collection The S...

Page 28: ...en a new window with the heading Review Project Information Figure 19 Figure 19 Project Information dialog box 3 Enter information to describe your project area You can give the project a Title Start Finish time and add Notes Note the gray button for Output Path This is the location where the SIR 20 will store your data files This location was set by you in View Customize All data entry on this sc...

Page 29: ...g features of interest at your survey site and for marking the linear distance surveyed You can end the survey by clicking the appropriate button on the collection toolbar You can also close and save the file by holding down the antenna tow handle marker button for 5 seconds To collect another profile with the same settings click the Run Project button green square Point Mode Data Collection This ...

Page 30: ...Data Set Click Next This will open a new window with the heading Review Project Information Figure 22 Figure 22 Project Information dialog box 3 Enter information to describe your project area You can give the project a Title Start Finish time and add Notes Note the gray button for Output Path This is the location where the SIR 20 will store your data files This location was set by you in View Cus...

Page 31: ...e antenna and enter that information in the channel selection area 10 Make sure that each antenna is plugged into the correct port on the back of the SIR 20 Make sure that when you are collecting data using two separate antennas in bi static mode that the control cables for each antenna are the same length If the antenna cables are of different lengths the transmit receive synchronization of the s...

Page 32: ...gnificantly improve the signal to noise S N ration of the output signal at the cost of increased data collection time Click the green arrow to begin collecting data Since you are collecting one scan at a time you will need to initiate data collection after every trace This can be done in three ways The SIR 20 will take a single scan every time you click the remote marker on your antenna handle cli...

Page 33: ...rmal profile order is one where you are collecting data along your profile in one direction In other words you start at the baseline collect data until the end of the line pick up the antenna and move it back to the baseline to collect the next profile in the same direction This is different from the zigzag method where you are simply turning around and collecting the next data file in the opposit...

Page 34: ...ith GPS This method uses GSSI s survey belt to maintain constant spacing between profiles It is not essential for the grid to be square or for the grid corners to be at right angles since the GPS provides an absolute system of coordinates and the data will be correctly positioned Survey Wheel This method allows collection of irregularly shaped grids Setup is similar to Fixed 3D grid but you must m...

Page 35: ...tomize All data input fields in this menu are optional If you do not wish to add notes click Next A window will open with the heading Data Collection Mode Figure 27 Figure 27 Data Collection Mode 4 This window gives you options of the three ways you can collect 3D radar data Note the button for Enable GPS This allows you to collect GPS co ordinate data along with your radar data See the section on...

Page 36: ... the Configuration window Figure 29 Configuration window 7 This screen controls your collection parameters Most of the time the default settings will be adequate To access settings for different applications click the small arrow in the Config Type 1 option You will see a broad list of application categories Select the one that best describes your specific application For example if you are scanni...

Page 37: ...already created A macro is nothing more than a saved list of data collection parameters These parameters include filters time range and gain settings These will vary from job to job so it is possible you will have many different macros for different survey objectives Figure 30 Attach a Macro or Create a New One There are no pre saved macros on the system so if you are using your SIR 20 for the fir...

Page 38: ...o This is done to insure that the entire transmitted pulse is recorded If this function is inadvertently turned off during system configuration the transmitted pulse zero time may not be present in the time range window If this occurs the data will be useless as you will have no zero time reference form which to measure time depth GSSI recommends that you leave the Auto Position servo ON until you...

Page 39: ...cons above from left to right the filters available during data collection are the IIR Infinite Impulse Response filter FIR Finite Impulse Response filter and Static Stacking and Background Removal filter respectively A detailed description of these filters is beyond the scope of this manual If you are interested in learning more about these filters and their effects we would refer your attention ...

Page 40: ...el encoder and the antenna is moving too quickly The beeping indicates that you are moving faster than the system can record the data In effect you are dropping scans along the profile If this occurs your profiles will not be the same length and the number of scans between your survey marks will not be consistent i e they will be non linear Once you get to the end of the line the SIR 20 will stop ...

Page 41: ...ners to be perfectly square Please see the Survey Belt documentation for instructions on belt field setup 1 Create a new collection project by going to File New or clicking the New Project button on the collection controls bar This will open a window with the heading Create New Data Collection Project Figure 34 File Name dialog box 2 Enter a project file name in the white box that is labeled File ...

Page 42: ...ct Survey Belt Figure 36 Data Collection Mode After about one second you will see the GPS information at the right side of the window become active A GPS is required for Survey Belt data collection Pay special attention to the data validity information Your SIR 20 will analyze the signal from the GPS and determine if the data is valid It makes this determination based on the number of satellites t...

Page 43: ...the default settings will be fine To access settings for different applications click the small arrow in the Config Type 1 option You will see a broad list of application categories Choose the one that best describes your application For example if you are scanning an area with a 400 MHz antenna to find underground utilities and storage tanks choose UTILITY Then choose your antenna type under Conf...

Page 44: ...our SIR 20 for the first time you will need to create one Click the button for Create New Macro and click Finish The antenna will initialize you will see a stop watch counting a few seconds and then the following window will pop up Figure 40 The Setup Screen 9 This window will allow you to further customize your collection parameters The window is divided into two main areas The top 2 3 of the win...

Page 45: ... of 100 This value is arbitrary and has to do with the delay time of transmit and receive signals within the electronics of the system This value does NOT affect the stored value of the range Gain The second button controls the Time Variable Gain TVG Gain is artificial signal amplification used to compensate for the natural effects of signal attenuation As the transmitted signal passes through a m...

Page 46: ...sted in learning more about these filters and their effects we would refer your attention to a text on digital signal processing Many of these values are antenna specific and are set automatically for the antenna that you chose in Step 6 If you are using an antenna other than one listed in the configuration presets you should alter the correct filter setting for the antenna being used Consult your...

Page 47: ... is moving too quickly The beeping indicates that you are moving faster than the system can record the data In effect you are dropping scans along the profile If this occurs your profiles will not be the same length and the number of scans between your survey marks will not be consistent i e they will be non linear Hold down the marker button on the antenna tow handle for at least five seconds to ...

Page 48: ...eel controlled 3D you will have to tell the SIR 20 when to stop collecting each individual file You will do this by holding down the marker button on your antenna tow handle for at least 5 seconds when you reach the end of each profile line Holding the button for more than 10 seconds will close the data collection project 1 Create a new collection project by going to File New or clicking the New P...

Page 49: ...ional 4 If you do not wish to add notes click Next A window will open with the heading Data Collection Mode The Data Collection Mode window provides you with a choice of the three ways you can collect 3D radar data Note the button for Enable GPS You can collect GPS data along with your grid See the section on using a GPS for details on setup Figure 45 Data Collection Mode Click the Survey Wheel bu...

Page 50: ...ngle direction Click Next to go to the Configuration window Figure 47 Configuration window 7 This screen controls your collection parameters Most of the time the default settings will be fine To access settings for different applications click the small arrow in the Config Type 1 option You will see a broad list of application categories Choose the one that best describes your application For exam...

Page 51: ...ve already created A macro is nothing more than a saved list of data collection parameters These parameters include filters time range and gain settings These will vary from job to job so it is possible you will have many different macros for different situations Figure 48 Attach a Macro or Create a New One There are no pre saved macros on the system so if you are using your SIR 20 for the first t...

Page 52: ...his is done to ensure that the entire transmitted pulse is recorded If this function is inadvertently turned off during system configuration the transmitted pulse zero time may not be present in the time range window If this occurs the data will be useless as you will have no zero time reference from which to measure time depth GSSI recommends that you leave the Auto Position servo ON until you ar...

Page 53: ...cons above from left to right the filters available during data collection are the IIR Infinite Impulse Response filter FIR Finite Impulse Response filter and Static Stacking and Background Removal filter respectively A detailed description of these filters is beyond the scope of this manual If you are interested in learning more about these filters and their effects we would refer your attention ...

Page 54: ...nna is moving too quickly The beeping indicates that you are moving faster than the system can record the data In effect you are dropping scans along the profile If this occurs your profiles will not be the same length and the number of scans between your survey marks will not be consistent i e they will be non linear Hold down the marker button on the antenna tow handle for at least five seconds ...

Page 55: ... or skip a line use the turquoise arrows at the bottom to move to the correct location Helpful Hint If you need to end a profile line early due to an obstacle hold down the marker button on your minicart for at least five seconds The line will close and you will be directed to the start of the next line ...

Page 56: ...Geophysical Survey Systems Inc SIR 20 Manual MN92 078 Rev F 50 ...

Page 57: ...llect 26 two foot long profiles collected in a specific order over that scan pad Optical Scan This program is for use with a 5100B or 5101 antenna and the optical barcode equipped minicart You will also need some of the barcode paper scan pads These come in 1x1 2x2 and 2x4 ft 30x30 60x60 and 60x120 cm sizes as well as the metric equivalents This is the latest edition to the StructureScan product f...

Page 58: ...know what the dielectric is from previous testing select the Custom Type and enter Dielectric Constant If unknown the value is pre set for the concrete type selected Set Scan Depth The computer will take this number and along with the dielectric figure out the time range automatically Always add a few inches to your estimated depth Check Survey Wheel Calibration The default values are 609 6 ticks ...

Page 59: ...t Click the Collect Data button F8 to begin data collection 4 Move your minicart forward in a straight line you will see the data appear on the screen as the minicart wheels turn Note Make sure the wheels of the cart are always in contact with your survey surface Sometimes when collecting data over a carpeted or dirty floor the survey wheel slips Since your system is only collecting data when the ...

Page 60: ...t returns to the point where it was initially reversed for feature ID Note Do not move handcart from the current survey line if you wish to continue data collection along this line Note The position cursor is active during data collection ONLY when backup cursor is activated 2 Press Stop to end data collection You will be prompted to save the data file Whether or not you save the scan will remain ...

Page 61: ... depth in the prompt window The depth scale will be recalculated and the screen display scale adjusted 6 Depth can be set in Playback mode using the same steps Playback You can also Playback data that you have previous collected and saved Files can be recalled using the Playback button F6 on the opening page of StructureScan Linescan You will see a listing of all of your saved data files Known tar...

Page 62: ... file this will appear on the top Click F3 to open second file Note The cursor information is active in both windows Zoom F6 The Zoom button will show the top half of the data file displayed File Information F10 The File Information button displays the file header that lists file setup filters gain range position and other reference information Figure 58 Figure 59 File ...

Page 63: ...wer than eight characters This will be the root name for each of your data files Click Next when you are done 4 Define collection parameters Choose your antenna type from the pull down menu at the top right corner of this window StructureScan is only configured to work with the 1 6 GHz and 1 5 GHz Do not scan a pad in the cross direction with the antenna turned 90 degrees in the cart Choose your m...

Page 64: ...ace grid pad over area to be scanned 2 Fix edges of pad to survey surface 3 Mark Registration Points for each corner We recommend marking the 0 0 corner with a different color than the other corners or mark the survey surface designating direction of first transect collected 4 Align survey cart on Line 1 The yellow line on the front of the encoder gray cart should align with the yellow line on the...

Page 65: ... mark collect 2 more inches of data enough to see the mark in the data 12Close and Save a data file Make sure not to add any extra marks 13Click Insert to stop data collection and Save or 14Click Delete to stop data collection and Delete To Continue Data Collection 2 X 2 Scan Pad Collection To collect more Grid files with the same settings as the previous setup 1 Hold antenna in the air with no ob...

Page 66: ...face hyperbolas Figure 64 File Description 9 If any end line marks are missing see Adding and Editing Marks at the end of this section 10Click StructureScan Process Data File You will be asked to choose a radar wave velocity for the migration Migration shrinks the legs of the point reflector hyperbolas enabling accurate Depth Slice imaging This function will correct for Surface Position Time 0 fil...

Page 67: ...Geophysical Survey Systems Inc SIR 20 Manual MN92 078 Rev F 61 Figure 65 Migration Comparisons ...

Page 68: ...ty row with an asterisk at the left edge 4 Type in the scan number where you want that marker to go and make sure that DistMark is checked Click Apply a few times and then close that window 5 Re run the processing on the data file Structure Scan Optical Optical Scan Use StructureScan Optical Scan with only the 2 6 GHz 1 6 GHz 1 5 GHz or 1 GHz antenna the optical minicart and the bar coded paper ma...

Page 69: ...he barcode in the corner of the paper Important Note If you have a blue metal minicart and are using it with a Model 5100B or 5101 orange padded bag you must hold down the red deadman switch on your cart to continue operation If you do not hold down the switch the antenna transmitter will not turn on and you will get a flat signal 7 With the minicart aligned at the beginning of your first profile ...

Page 70: ...tureScan Process Data File You will have to choose an appropriate Radar Wave Velocity for the Migration Migration shrinks the legs of the point reflector hyperbolas enabling accurate Depth Slice imaging This function will correct for Surface Position Time 0 filter and migrate data You will then have the raw data and the processed data on the screen at the same time Look at what happened to the hyp...

Page 71: ... change Parameters right click in grey scale band left side of window Color Display Select Color Table and Color Xform Xform different distribution of color value that helps enhance display Horizontal Scale Turn Off or On Helpful Hint Try with different Color Tables and Color Transforms for best analysis of data Data displayed herein is in Color Table 22 3 Move through Depth Slices by clicking on ...

Page 72: ... 2 Click the S3D Info File button and name the new Super 3D file to be created and click OK 3 Enter your basic grid size This is either 12 12 or 24 24 4 Enter the Y Grids and X Grids in your survey area 5 Click on a Grid Cell on the Grid Entry Map to enter the name of the grid to insert Make sure that the location you click on is the correct grid location for your data 6 Once all files are entered...

Page 73: ...ing its own NMEA GGA info Note GSSI only supports the G30L receiver logger All other GPS integrations are to be performed by the customer Attaching a GPS 1 Plug in your GPS to the serial port on the back of the laptop and power up your GPS according to the manufacturer s instructions Set your GPS to log the NMEA GGA data string and to communicate at 4800 If you are using the G30L plug in the seria...

Page 74: ... and higher incorporates into its database This section gives a quick GPS overview and then describes what you need to know in order to effectively use the SIR 20 with a GPS What is it GPS is a satellite navigation system provided free by the USDoD designed to provide instantaneous position velocity and time information almost anywhere on the globe at any time and in any weather It typically provi...

Page 75: ...dium For GPS this means the signal from the satellites to your receiver can get slowed down and bent by changes in the Ionosphere the Troposphere and even nearby objects These sources of error can be reduced using expensive tricks like dual frequency Klobuchar modeling and Real Time Kinematic RTK solutions The least expensive way to correct for these errors is through Differential GPS DGPS where d...

Page 76: ...ce with other NMEA compatible units that output waypoints in the NMEA sentences GPRMC or GPGGA and GPVTG or GPGLL and GPVTG If your GPS outputs a GGA command every second in a standard serial fashion 4800 baud 8 bit no parity 1 stop bit and if you can get your tracklog into OziExplorer then we can talk to your GPS with RADAN 6 Also if you can get that NMEA GGA string to log in an ASCII text txt fi...

Page 77: ...n of each scan This can be done in Microsoft Visual Basic or with Simulink MatLab to get the two data files together Our Binary file extension is TMF The tracklog output of your GPS software will have a unique extension that s why we prefer the Oziexplorer plt file so that all the various GPS s can output data in one format For Time based data acquisition Match GPS Start Stop position time with re...

Page 78: ...month 1 Jan 2 Feb etc unsigned year 7 year 1980 0 127 1980 2107 struct tagRFCoords Start End position float rh_fstart float rh_fend struct RGPS GPS record system time SYNC char RecordType 4 GGA DWORD TickCount CPU tick count double PositionGPS 4 Latitude positive if N Longitude positive if E Altitude FIXUTC B Constants and macros constants const int MINHEADSIZE 1024 const int PARAREASIZE 128 const...

Page 79: ... short rh_ntext size of text 46 short rh_proc offset to processing history 48 short rh_nproc size of processing history 50 short rh_nchan number of channels 52 FLOATBYTE rhf_epsr average dielectric constant 54 FLOATBYTE rhf_top position in meters 58 FLOATBYTE rhf_depth range in meters 62 COORDBYTE rh_coordX X coordinates 66 FLOATBYTE rhf_servo_level gain servo level 74 char reserved 3 reserved 78 ...

Page 80: ...ystem time SYNC DWORD ScanNumber 24 bit scan number DWORD TickCount 32 bit internal clock tick count in mS B Constants and macros constants const int GPSAREASIZE 2 sizeof RGPS C Time Marks File TMF struct RGPS startGPSpos the same as in radan file header struct RDMT markTime nMarks one record for every distance or user mark struct RGPS endGPSpos the same as in radan file header Minimum file size i...

Page 81: ... Response IIR Finite Impulse Response FIR Boxcar and Triangular filter types are available Infinite Impulse Response Filter IIR Low Pass 2 poles High Pass 2 poles Finite Impulse Response FIR Boxcar and Triangle Low Pass up to scan length High Pass up to scan length Horizontal Filters IIR Stacking 1 to 16384 scans Background Rem 1 to 16384 scans Static Stacking 2 to 32768 scans Background Removal R...

Page 82: ...65 135 512 153 78 1025 78 39 2048 39 19 Input Power 12 volts DC nominal with operating range of 11 15 volts 60 watts Thermal Operating Temperature 10o C to 40o C external Relative Humidity 95 non condensing Storage Temperature 40o C to 60o C Radar System Parameters2 Signal to noise ratio 110 dB Dynamic range 110 dB Time base accuracy 02 1 Limited only by computer hard disk capacity 2 Does not incl...

Page 83: ...ite Accessibility Topography One of the first things you should consider about a new survey area is the topography In the first place you need to be able to physically move the antenna over the ground surface in a fairly smooth fashion Areas that are full of trenches or extreme slopes are not ideal You can still survey an area of broken terrain but it may require collecting point data rather than ...

Page 84: ...to help you understand soils Site Accessibility Simply put can you feasibly work in the proposed area Is the site in the middle of a dense thicket of trees or is it the outside of a tall building or a tight elevator shaft Remember that GPR and geophysics depends on your ability to see contrasts in the data The area has to be large enough for you to collect enough data to be able to make an interpr...

Page 85: ...o draw a recognizable hyperbola or worse missing the target altogether Generally you need a minimum of 10 scans to draw a recognizable hyperbola The rule of thumb is to have 10 scans divided by the depth of the shallowest object So if you want to image something 10 feet deep 10 scans 10 feet 1 scan foot For 5 feet 10 scans 5 feet 2 scans foot For locating structural features in concrete with the 1...

Page 86: ...cal property of the material that most governs dielectric Even though concrete and grade are qualitatively very different they are made of similar materials and react to radar energy similarly It is usually extremely difficult to tell the top of grade from the bottom of the slab You should practice trying to image different materials so that you can build up a body of experience See Appendix D for...

Page 87: ...D map for its own sake there are really only three main reasons a complicated area prospecting or dangerous targets in the subsurface A complicated area might be a city street with many different types of pipes running in different directions In a situation like that the best option is usually to do 3D data collection so that you are able to visually track targets as they twist and turn around oth...

Page 88: ...Geophysical Survey Systems Inc SIR 20 Manual MN92 078 Rev F 82 ...

Page 89: ...a Please note that these are only generalized setups and it may be necessary to alter these to your particular situation For example deeper penetration can be set by increasing the range during setup Dipole Spacings in Common GSSI Antennas Antenna Model Frequency Dipole Spacing Dipole to Edge of Antenna Housing 5100B 1 6GHz 60 mm 30 mm 5100 1 5 GHz 60 mm 30 mm 5101 1GHz 100 mm 25 mm 3101 900 MHz 1...

Page 90: ...wing window is approximately 18 inches in concrete Setting is optimized for scanning of structural features in concrete Range 12 ns maximum 20 ns Samples per Scan 512 Resolution 16 bits Number of gain points 5 Vertical High Pass Filter 250 MHz Vertical Low Pass Filter 3000 MHz Scans per second 100 Vertical IIR High Pass N 2F 10 MHz Transmit Rate 100 KHz 1 0 GHz Model 5101 1 0 GHz ground coupled an...

Page 91: ... no longer manufactured 500 MHz antenna Not Model 3102 HP or 3102 DP Data Collection Mode Continuous Range 60ns Samples per Scan 512 Resolution 16 bits Number of gain points 3 Vertical High Pass Filter 125 MHz Vertical Low Pass Filter 1000 MHz Scans per second 64 Transmit Rate 100 KHz 400 MHz Model 5103 400 MHz ground coupled antenna Depth of viewing window is approximately 4m assuming a dielectri...

Page 92: ...nna Lower frequency antenna optimized for mid range profiling Pulse duration is 5 ns Range 100ns Samples per Scan 512 Resolution 16 bits Number of gain points 5 Vertical High Pass Filter 50 MHz Vertical Low Pass Filter 600 MHz Scans per second 100 Transmit Rate 100 KHz 100 MHz Model 3207 100 MHz ground coupled antenna Low frequency for deeper profiling Pulse duration is 10 ns Range 500ns Samples p...

Page 93: ... functioning correctly at the different rate 300 Deep Old 300 MHz antenna Data Collection Mode Continuous Range 300ns Samples per Scan 1024 Resolution 16 bits Number of gain points 5 Vertical High Pass Filter 100 MHz Vertical Low Pass Filter 1000 MHz Scans per second 32 Horizontal Smoothing 5 scans Transmit Rate 50 KHz 300 Shallow Old 300 MHz antenna Data Collection Mode Continuous Range 150ns Sam...

Page 94: ...16 bits Number of gain points 5 Vertical High Pass Filter 15 MHz Vertical Low Pass Filter 150 MHz Scans per second 16 Horizontal Smoothing 5 scans Transmit Rate 12 KHz Subecho 40 Data Collection Mode Continuous Range 1000ns Samples per Scan 512 Resolution 16 bits Number of gain points 5 Vertical High Pass Filter 10 MHz Vertical Low Pass Filter 80 MHz Scans per second 32 Transmit Rate 12KHz 80 MHz ...

Page 95: ...ass Filter 6 Vertical Low Pass Filter 40 Scans per second 32 Stacking 32 scans Transmit Rate 12KHz MLF 600 cm Low Frequency antenna set to a length of 6 0m Data Collection Mode Point Range 1000ns Samples per Scan 512 Resolution 16 bits Number of gain points 5 Vertical High Pass Filter 1 Vertical Low Pass Filter 50 Scans per second 32 Stacking 32 scans Transmit Rate 12 KHz Borehole 120 MHz Borehole...

Page 96: ...Geophysical Survey Systems Inc SIR 20 Manual MN92 078 Rev F 90 ...

Page 97: ...C Acronym for Federal Communications Commission The United States governmental body that oversees the UWB industry of which GPR is a part Gain amplifying the signal to certain section of a radar pulse in order to counteract the effects of attenuation and make features more visible GHz Acronym for Gigahertz A measurement of frequency equal to one billion cycles per second GPR Acronym for Ground Pen...

Page 98: ... two attributes time and reflection amplitude A third attribute position is assigned by the user Under sampling will produce a scan wave that does not contain enough information to draw a smooth curve It may miss features Over sampling will produce a larger data file Samples Scan the number of samples recorded from an individual radar scan Commonly set to 512 Scan one complete reflected wave from ...

Page 99: ...m Willsky and Young 1983 Signal and Systems Prentice Hall Reynolds John M 1997 An Introduction to Applied and Environmental Geophysics Wiley and Sons Roberts R L Daniels J J 1996 Analysis of GPR Polarization Phenomena JEEG 1 2 139 157 Sheriff R E and Geldart L P 1985 Exploration Seismology Volume 1 History Theory and Data Acquisition Cambridge University Press New York 253 p Sheriff R E and Geldar...

Page 100: ...esources Conservation Service Ground Penetrating Radar Program http nesoil com gpr 4 USDA Natural Resources Conservation Service GPR Soil Suitability http www nrcs usda gov wps portal nrcs detail soils use maps cid nrcs142p2_053622 5 USDA Natural Resources Conservation Service Web Soil Survey http websoilsurvey sc egov usda gov App HomePage htm 6 North American Database of Archaeological Geophysic...

Reviews: