ANALYSING YOUR MEAUSUREMENT
3.3
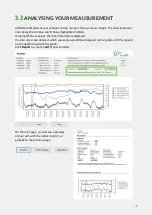
All Relevant Details of your Analysis can be found at the top of your Graph. The most important
ones being the U-Value and R-Value, highlighted in Bold.
Underneath these values, the ISO conformity is displayed.
You can select and deselect which values you would like displayed on the graph, with the legend
on the righthand side of the graph.
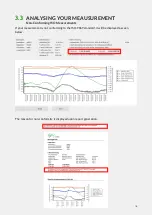
Click
Report
to create a
of your Analysis.
On the next page, you will see a preview
of your pdf, with the option to print, or
go back to the previous page.
15
Summary of Contents for GO MEASUREMENT SYSTEM II
Page 1: ...gOMS II greenTEG GO MEASUREMENT SYSTEM II USER MANUAL...
Page 2: ...CONTENTS I 01 02 03 04 OVERVIEW SET UP ANALYSING MEASUREMENTS APPENDIX...
Page 9: ...01 02 03 04 OVERVIEW SET UP ANALYSING MEASUREMENTS APPENDIX CONTENTS 7...
Page 13: ...CONTENTS 12 01 02 03 04 OVERVIEW SET UP ANALYSING MEASUREMENTS APPENDIX...
Page 18: ...CONTENTS 17 01 02 03 04 OVERVIEW SET UP ANALYSING MEASUREMENTS APPENDIX...
Page 22: ...Appendix C Detailed explanations of the parameters used in the report 4 3 21...


