Gen3 AutoCAF2+ Instruction Manual & Operating Manual Download Page 35

Page 

35

 of 

42


Exporting Spreadsheet 

 
To  export  all  results  into  an  excel  spreadsheet,  select  the  ‘Export’  option  from  the  toolbar  and  then  select 
new spreadsheet.  


Figure 47 

 
Selecting ‘new spreadsheet’ will open a new window requiring the user to select the filepath location and 
name the resultant excel spreadsheet.  


Figure 48 

 
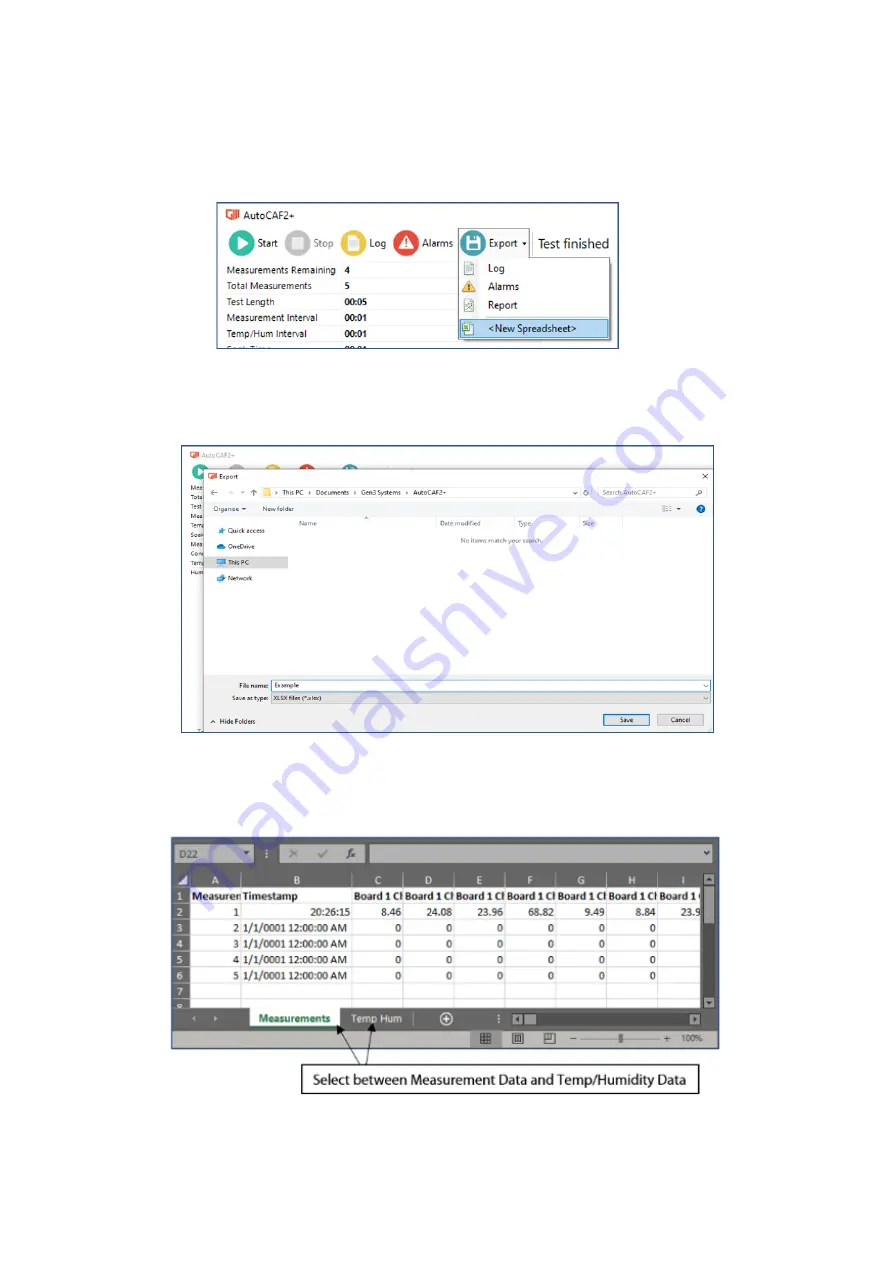
In the resultant spreadsheet the measurement data and temp/humidity data is on two different sheets and 
can be navigated by the tabs as in figure 49.  


Figure 49 

Summary of Contents for AutoCAF2+

Page 1: ...Page 1 of 42 AutoCAF2 INSTRUCTION MANUAL OPERATING GUIDE ISSUED 2021 23 06...

Page 2: ...5 6 X Axis Format Selection Pages 16 17 5 7 Output Value Low Measurement Alarms Page 18 5 8 Temperature Humidity Interval Limit Setup Page 19 5 9 Board Channel naming selection Page 20 5 10 Standard...

Page 3: ...Page 3 of 42 6 2 2 Connectors 6 2 3 Cables 6 2 4 Design 6 3 High Voltage Testing 7 AutoCAF2 Technical Specification Page 42 8 High Voltage Testing CLR1250 Bridge Page 43...

Page 4: ...e under normal use according to the instructions given in the manual 2 GUARANTEE All Gen3 equipment hardware and software is fully guaranteed to meet the CE standards of the European Union and the war...

Page 5: ...54 x 39cm in size Before opening check the crate for any external damage that may have occurred during delivery If the crate has sustained any serious damage the carrier should be contacted immediate...

Page 6: ...amework 4 7 2 installer MCP 2221 Windows Driver Operating Manual Facts and Data book SIR CAF Testing Note If you are not permitted to use USB Flash drives please contact techsupport gen3systems com an...

Page 7: ...e readings therefore the measurement cabling should always be fully screened The unit should be placed onto a stable surface and away from areas where it could be disturbed If the AutoCAF2 is placed c...

Page 8: ...ained by hand is likely to expose live parts The apparatus shall be disconnected from all voltage sources before it is opened for any adjustment replacement maintenance or repair Capacitors inside the...

Page 9: ...nd plug it into the mains socket at the rear of the unit Connect USB cable between AutoCAF2 and USB port in the PC Switch on the unit using the on off switch located to the rear of the unit The AutoCA...

Page 10: ...escribed herein shall be deemed to be a warranty by Gen3 for any purpose or give rise to any liability by Gen3 whatsoever In no event shall Gen3 be liable for any accidental indirect special or conseq...

Page 11: ...allation Open the AutoCAF2 folder on the provided USB and open the exe file to begin software installation on the first screen choose the desired filepath for installation then select next Figure 2 On...

Page 12: ...stage select Finish Figure 4 5 2 Language Selection Upon opening the AutoCAF2 software for the first time a language selection screen will appear once selected the software will upon N B Once languag...

Page 13: ...sion of software that is installed it also contains a link to the Gen3 website Figure 7 N B The version pictured may not be the current revision of software received on the USB stick 5 4 Manual The Au...

Page 14: ...automatically appear in the drop down menu and which machine type either a 64 128 or 256 The user will also have the option to choose if applicable which CLR bridge to attach N B The correct machine...

Page 15: ...Page 15 of 42 Figure 11 The following shows an example of a graph with Measurement set as the X Axis this test shows 1min intervals for 10 measurements Figure 12...

Page 16: ...he following shows an example of a graph with Minutes set as the X Axis this test shows 1 min intervals for 10 measurements Figure 13 The following shows an example of a graph with Hours set as the X...

Page 17: ...resistance alarm limit can be set if Log10 Resistance is selected then the low measurement must be set in Log scale N B Any measurement record that falls below this limit will be recorded in the Alar...

Page 18: ...imit Setup During this setup process if a Temperature Humidity probe is required the Minimum and Maximum alarm limits must be set N B Any T H measurement that falls outside of the desired ranges will...

Page 19: ...s Channels to change the window to the board and channels settings On this screen to turn on and off desired boards and channels simply click on the tick boxes to turn on and off to rename boards and...

Page 20: ...Measurements this is not editable it is a calculation between the test length and measurement interval 4 Measurement Interval 24 hour format 5 External Voltage greyed out unless either is selected in...

Page 21: ...Page 21 of 42 5 11 Multiple Bias Test The below shows an example of the form change if multiple Bias selection is required Figure 21 Figure 22...

Page 22: ...e of the Test Parameters form if a predefined custom template is selected Figure 23 After a template has been selected if any of the predefined parameters are changed when the test start is selected t...

Page 23: ...tive throughout the duration of the test and will disappear once the test is completed Figure 25 When a test is started using an external voltage over 300V a high voltage test running bar will appear...

Page 24: ...e options the user is free to use the software including 1 Communications Test Log 2 Low Measurement Alarm Log see section 5 16 3 Measurement Timer 4 Live Data see section 5 17 5 Temperature and Humid...

Page 25: ...elect Alarms in the toolbar Figure 28 The alarms window displays the following information for each measurement that drops below your chosen Alarm limit 1 Timestamp of most recent recording for releva...

Page 26: ...button scroll with a mouse over the graph title Figure 30 The user can also zoom in anywhere on the live data chart to view a specific data set scroll to a set point using a mouse and then use the sc...

Page 27: ...to hover over a particular channel to be shown the Board and Channel name also displayed will be the value of measurement in either Log Resistance or Resistance in M Log10 Resistance Output Value Fig...

Page 28: ...f of the user interface data for temperature and humidity and each measurement board can be viewed To switch between graphs simply select an available graph on the bottom left of the user interface to...

Page 29: ...nnels this can be done by clicking on the required channel in the index on the right hand side of the graph N B If a channel is turned off this is merely for viewing purposes on the graph the channel...

Page 30: ...n measure is a function of the test voltage and will happen the following maximum limits for each test voltage available from the Bias Power Supply Selectable Test Voltage Maximum Resistance 3 3V 12 0...

Page 31: ...sults graphs as a JPEG file at any desired location To do this right click using a mouse anywhere on the graph and select save Figure 38 Once save has been selected a new window will appear asking for...

Page 32: ...irectly print either of the two resulting graphs To do this right click using a mouse anywhere on the desired graph and select print Figure 40 Once print has been selected a new window will appear sho...

Page 33: ...s open the Export option in the toolbar and then select alarms to export the log as a csv file Figure 42 Once Alarms has been selected a new window will open where the filepath must selected and the f...

Page 34: ...then select report Figure 45 This will open the results in a report format with test information on the first page followed by all available results graphs from the boards that were selected for the...

Page 35: ...ct new spreadsheet Figure 47 Selecting new spreadsheet will open a new window requiring the user to select the filepath location and name the resultant excel spreadsheet Figure 48 In the resultant spr...

Page 36: ...or the test file open the filepath location and open the Gen3 file Figure 50 This will reload the data into the AutoCAF2 software which can then be used to manipulate all data readings graphs and expo...

Page 37: ...he settings can be reset to default factory settings by holding CTRL and closing the software Figure 52 Once the software is closed a new window will appear confirming that the settings file is to be...

Page 38: ...s also known as guard bands Figure 52 The wires should be separated into pairs measurement and ground and the insulation stripped from the measurement wire at the free end The stripped measurement wir...

Page 39: ...est program BIAS 3 For connection of internal or external bias to the test site only when using the BELLCORE 25 test program COM For connection of external bias power supply commons INTERLOCK This soc...

Page 40: ...supplied fitted with four Halogen Free measurement cables 2 25m in length with screening to minimise cross talk between measurement channels 6 2 4 Design Due to the test racks versatile design it may...

Page 41: ...external power source Bias Voltage Accuracy internal power source 0 3 at 100V Equilibration Voltage Delay Prior to Measurement Up to 40 seconds less than measurement interval Number of Test Points 16...

Page 42: ...nplugged either the input socket 1250V or the output socket 300V there is no risk to the operator safety from the Bridge Box 3 Coupon Connecting Cable a In compliance with system integrity performance...

Reviews: