


Page
29
of
42
The individual board graphs have the same zoom features as in section
5.17
, an additional feature with the
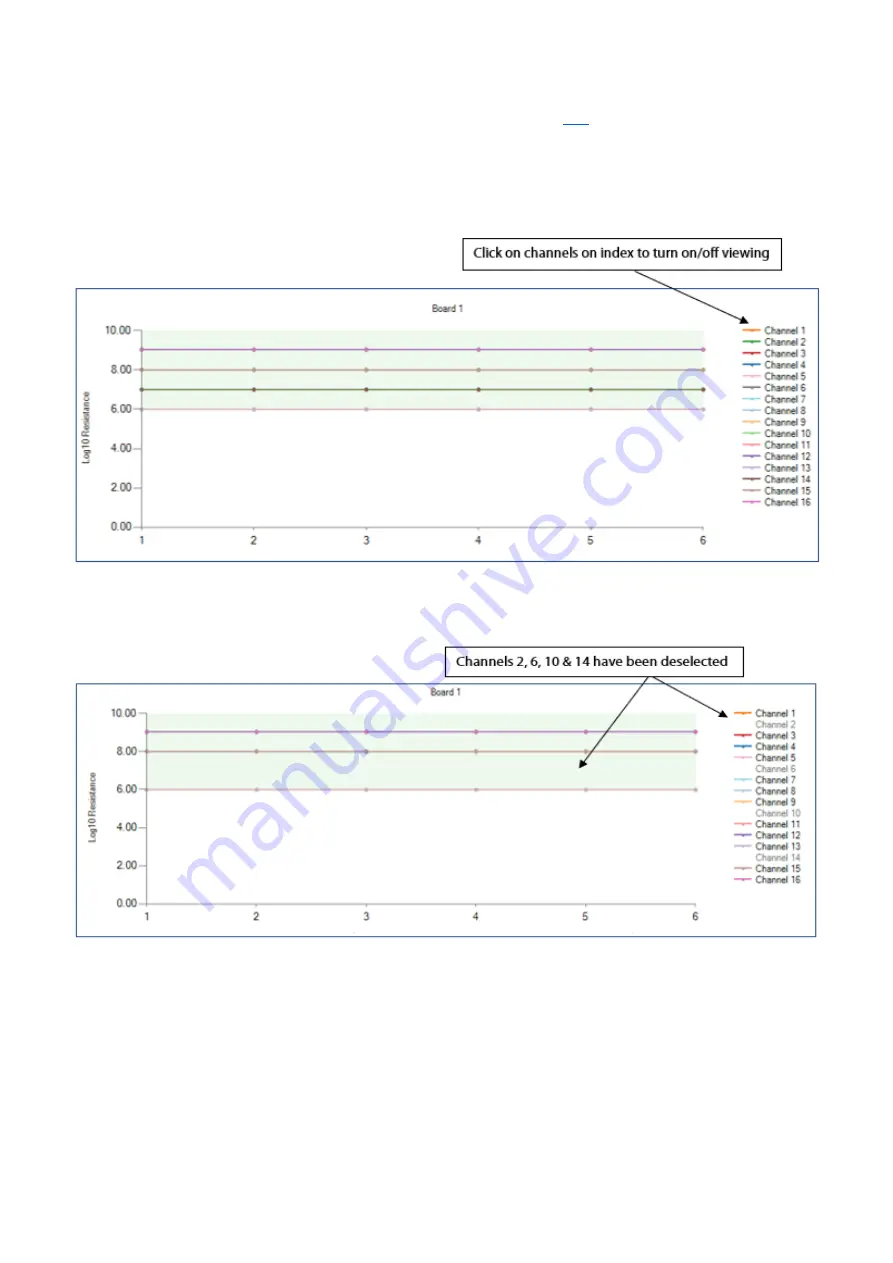
individual graphs is the ability to turn on and off viewing of desired channels, this can be done by clicking on
the required channel in the index on the right hand side of the graph.
N.B. If a channel is turned off this is merely for viewing purposes on the graph, the channel will still be
measured each sample and the graph updated accordingly when viewing is turned back on.
Figure 36
In figure 37 below channels 2, 6, 10 & 14 have been deselected from figure 36.
Figure 37