


Page
26
of
42
5.16
Live Data Chart
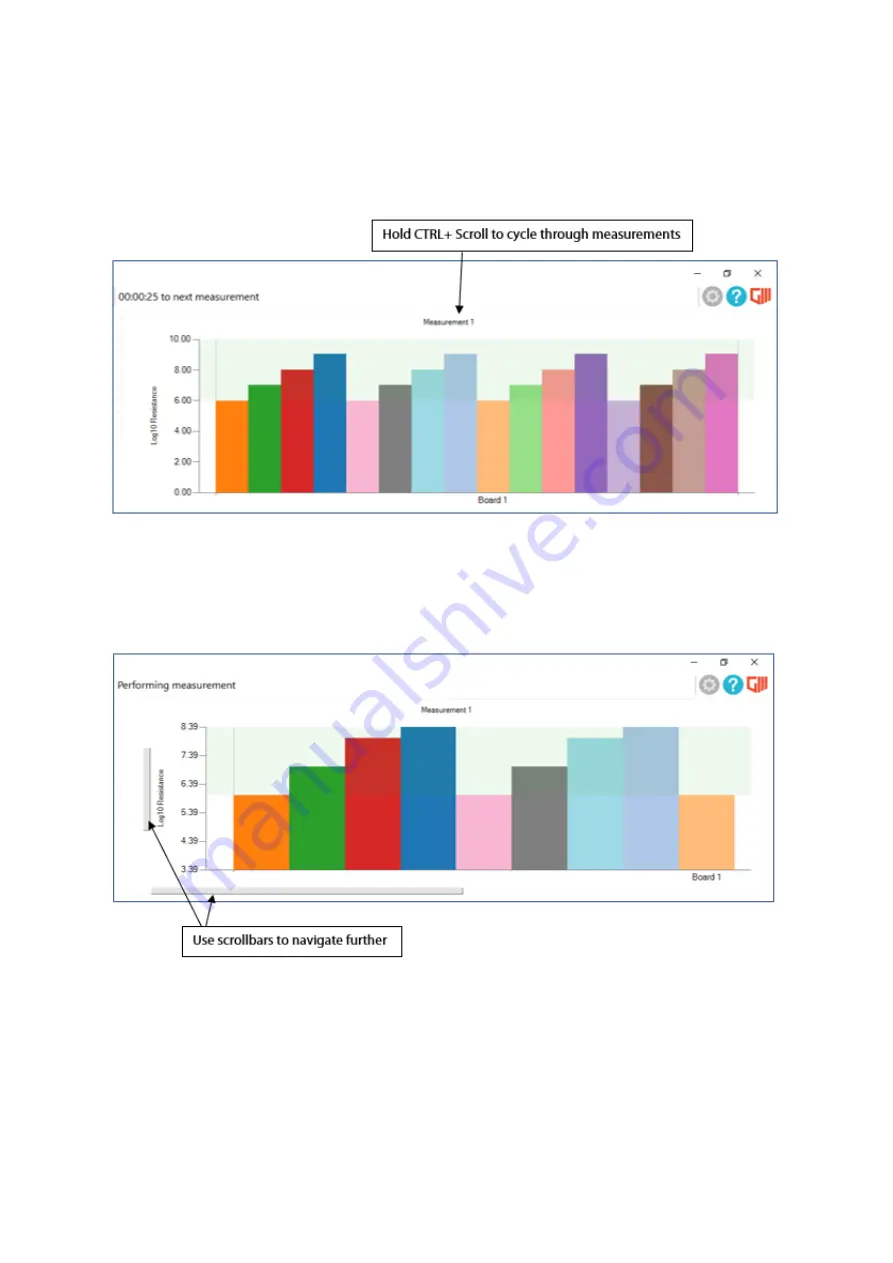
The live data chart updates every measurement cycle and will automatically update to the current
measurement data. The user has the ability to ‘scroll’ back to previous measurement data, to do so hold
CTRL + left mouse scroll with a mouse over the graph title.
Figure 30
The user can also zoom in anywhere on the live data chart to view a specific data set, scroll to a set point
using a mouse and then use the scroll bars to navigate further. To zoom in either use the scrollbar on the
mouse or press CTRL + Right click to zoom into where the cursor is located.
Figure 31
N.B. To exit the zoom feature at any point, right click on the graph and select restore zoom.