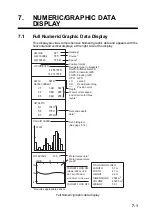


7. NUMERIC/GRAPHIC DATA DISPLAY
7-4
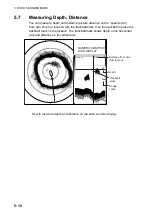
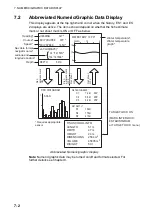
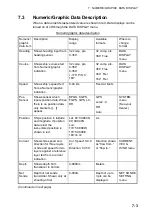
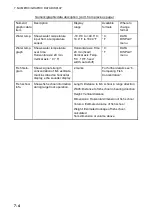
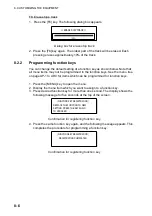
Numeric/graphic data description (con’t. from previous page)
Numeric/
graphic data
item
Description Display
range
Available
formats
Where to
change
format
Water temp. Shows water temperature
input from a temperature
sensor.
-10.0
°
C to +40.0
°
C,
14.0
°
F to 104.0
°
F
°
C,
°
F
DATA
DISPLAY
menu
Water temp.
graph
Shows water temperature
over time.
Horizontal axis: 20 min.
Vertical axis:
°
C (
°
F)
Horizontal axis: Time
20 min (fixed)
Vertical axis: Temp.
5
°
C, 10
°
F, fixed
width, auto shift)
°
C,
°
F
DATA
DISPLAY
menu
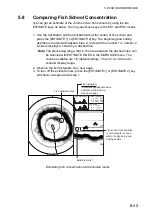
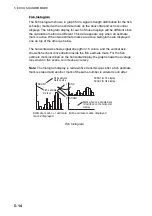
Fish histo-
gram
Shows signal strength
concentration of fish estimate
mark inscribed on horizontal
display, echo sounder display
2 marks
For further details see “6.
Comparing Fish
Concentration”.
Fish school
Info.
Shows fish school information
during target lock operation.
Length: Distance to fish school in range direction
Width: Distance to fish school in bearing direction
Height: Vertical distance
Dimensions: Horizontal dimension of fish school
Volume: Estimated volume of fish school
Weight: Estimated tonnage of fish school,
calculated
from dimension or volume above.
Summary of Contents for FSV-84
Page 1: ...COLOR SCANNING SONAR FSV 84 ...
Page 6: ...SAFETY INSTRUCTIONS iv This page intentionally left blank ...
Page 34: ...1 OPERATIONAL OVERVIEW 1 18 This page intentionally left blank ...
Page 158: ...4 SLANT MODE 4 48 This page intentionally left blank ...
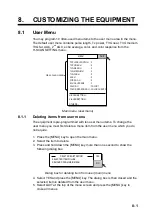
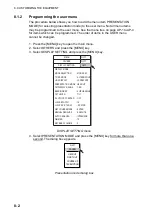
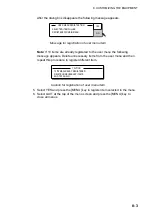
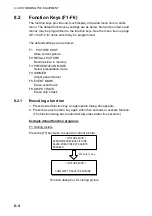
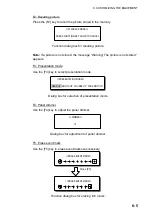
Page 194: ...8 CUSTOMIZING THE EQUIPMENT 8 10 This page intentionally left blank ...


