


Using the shelf manager system event log (SEL)
Using the shelf manager CLI
FortiGate-5140B Chassis Guide
72
01-500-156415-20151104
The sensors on the various FRUs report back to their respective IPMC. Sensors
connected to chassis FRU devices like the fan trays or power entry modules can report
back their sensor readings through either IPMC 10h/12h or through the Logical 20h
address, but not both. Sensors on ATCA boards always report back through their
respective blade IPMC address.
•
Backup battery voltage sensor on SM1 = (IPMC 10) Sensor #6
•
RPM of fan 1 of 2 in Fan Tray 0 = (IPMC 10) Sensor #7
•
RPM of fan 2 of 2 in Fan Tray 2 = (IPMC 10) Sensor #14
•
Physical presence of Fan Tray 2 = (IPMC 20) Sensor #14
•
Chassis center exhaust temperature = (IPMC 20) sensor #120
•
Slot 1 FG-5005FA2 ambient incoming temp = (IPMC 82) Sensor #12
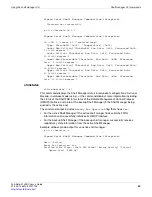
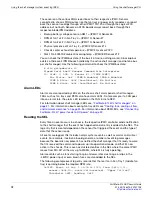
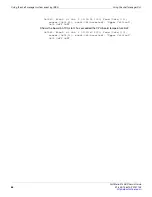
You can check the IPMB bus state (if the bus it in failure, nothing works). A backup bus
exists so there are 2 IPMB buses handled by the active shelf manager (and not one bus
per shelf manager). Use the following command to check the IPMB bus state:
# clia getipmbstate 10
Pigeon Point Shelf Manager Command Line Interpreter
10: Link: 0, LUN: 0, Sensor # 1 ("IPMB LINK")
Bus Status: 0x8 (IPMB-A Enabled, IPMB-B Enabled)
IPMB A State: 0x08 (LocalControl, No failure)
IPMB B State: 0x08 (LocalControl, No failure)
Alarm LEDs
Alarms are also reported by LEDs on the chassis shelf alarm panel or shelf manager.
FRUs such as fan trays and PEMs also have alarm LEDs. So for example, if a FAN goes
into an alarm state, the alarm LED located on the FAN turns to RED.
For information about shelf manager LEDs see,
“FortiGate-5144C shelf managers” on
. For information about cooling fan tray LEDs see
“Cooling fans, cooling air flow,
and minimum clearance” on page 25
. For information about PEM LEDs, see
FortiGate-5144C power feeds to DC power” on page 22
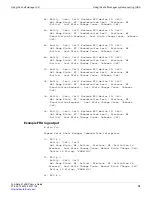
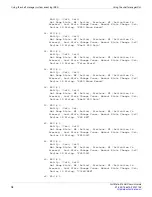
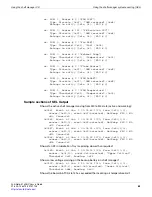
Reading the SEL
Every time an event occurs in a chassis, the respective IPMC controller sends notification
to the shelf manager that the event has happened and an entry is added to the SEL. The
log entry that is created depends on the sensor that triggered the event and the type of
data that the sensor reads.
All events are logged, this includes normal system events as well as alarms and critical
events. For example, insertion a board generate a number of event log messages
because the board is now present, has notified the shelf manager that it’s ready to work,
that it’s received the command to power up into operational mode, and that it’s now
active in the chassis. This is seen as clustered entries in the SEL where the same IPMC
moves from M0-M1 all the way up to M3-M4, where M4 is fully operating.
Alarm events such as fans starting to spin at slower rates due to age, or dips in the
-48VDC power input or even blown fuses are also added to the SEL.
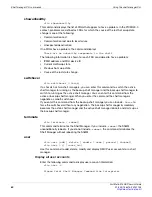
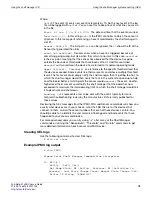
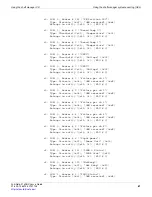
The following example event log entry records that the rear fan in Fan Tray 1 (middle fan
tray) is spinning below the required RPM rate.
0x018D: Event: at Jan 1 00:02:15 1970; from:(0x10,0,0);
sensor:(0x04,10); event:0x1(asserted): "Upper Critical",
Threshold: 0xff, Reading: 0xff


