


Performing Acquisitions
High Performance Power Meter
73
Consulting Acquired Data
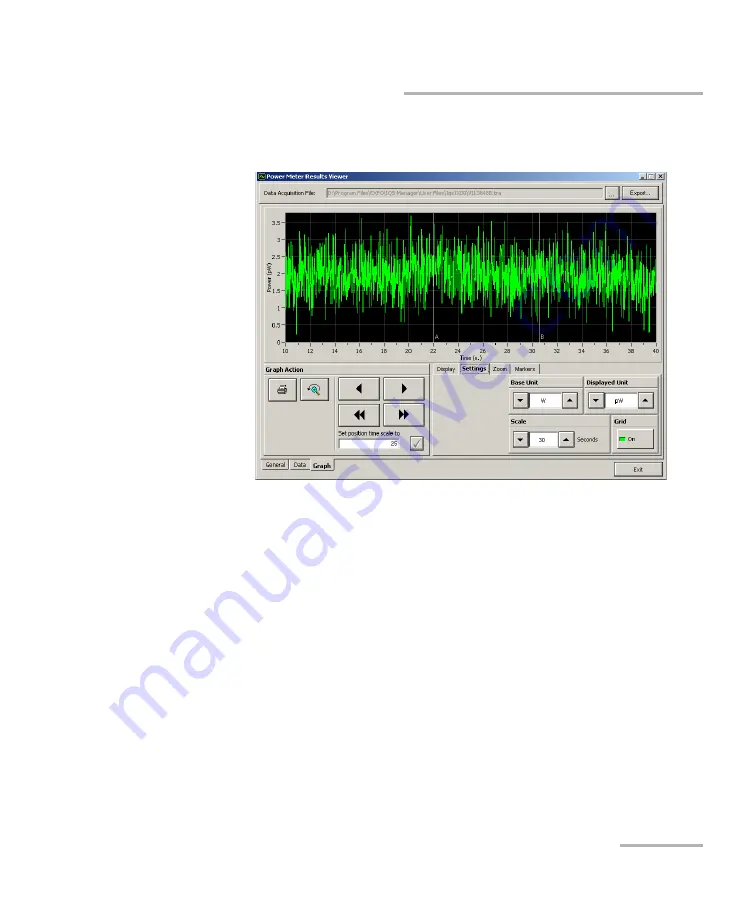
To view the graph corresponding to your acquisition data, select
the
Graph
tab.
To move along the time scale, use the arrow buttons.
The single arrow buttons will move by increments or decrements
representing 10 % of the current trace scale value.
The double arrow buttons will move by increments or
decrements of the current screen display (for example, the 10 to
40 seconds display would become 40 to 70 seconds in the figure
above).
To center on a specific value, type it in the
Set position time scale
to
box.
The other buttons and tabs are identical to those found in your
power meter application’s
Graph
tab. See
on page 75 for details.
Summary of Contents for IQS-1700
Page 1: ...User Guide High Performance Power Meter and Optical Head for IQS 600 IQS 1700...
Page 5: ...Contents High Performance Power Meter v Index 189...
Page 8: ......
Page 14: ......
Page 16: ......
Page 44: ......
Page 64: ......
Page 96: ......
Page 114: ......
Page 196: ......