


ELite 5, User Manual
Page 72 of 159
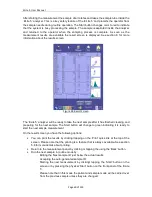
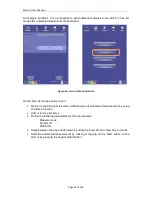
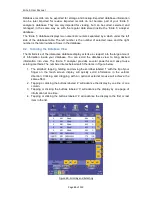
7.5 Result Display
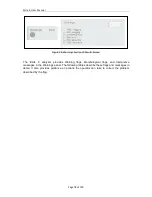
After the analysis is completed, the result screen displays all measured parameters, flags,
histograms and scatter plots. This information is automatically stored in the database, and
stored result data can be retrieved at any time from the database.
Histograms and scatter plots can be zoomed for closer inspection. Click or tap the histogram
or scatter plot to magnify it. Click or tap the ‘Close’ button on the upper right corner of the
image to close it and return to the result display.
Figure 51. Results Display and Magnified Scatter Plot
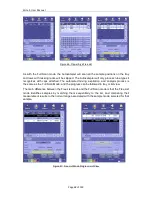
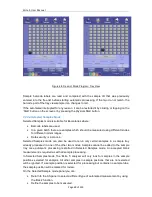
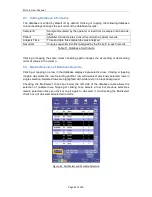
Comparison of parameters to the normal range can be displayed numerically or graphically.
See section 13.7 for more information on display of normal range status. Other kinds of flags
are also displayed in the result screen.
See section 8 for detailed information about the ‘ELite 5’ result screen.
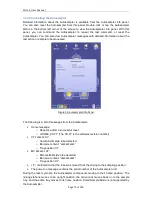
7.6 Printing Reports
Click or tap the Print icon at the top of the screen to send a report (or any displayed screen)
to the external printer.
7.7 The Measurement Process
The ‘ELite 5’ analyzer measures 24 parameters of whole human blood samples. Internal
dilutions are made to allow measurement of particles in the sample. Manual or automatic
mode samples are processed in the same way.
Summary of Contents for ELite 5
Page 13: ...ELite 5 User Manual Page 13 of 159 Figure 1 ELite 5 with Autosampler Space Requirements...
Page 27: ...ELite 5 User Manual Page 27 of 159 Figure 9 4DIFF Scatter Diagram...
Page 142: ...ELite 5 User Manual Page 142 of 159 20 3 Printed Report Formats...
Page 143: ...ELite 5 User Manual Page 143 of 159...
Page 153: ...ELite 5 User Manual Page 153 of 159 20 5 Fluidic System...