Getting Started
Displaying Interactive Reports
Enterasys IPS Analysis and Reporting Guide 1-7
Filter the data further by selecting an existing filter from the
Filter
drop down list, or by creating a
new filter, as described in “
Creating and Editing Report Filters
” on page 1-10.
The default chart type for the main reports is Column, but you can interactively change the chart
type to Pie or Bar, and for some charts, you can display the data in Logarithmic scale.
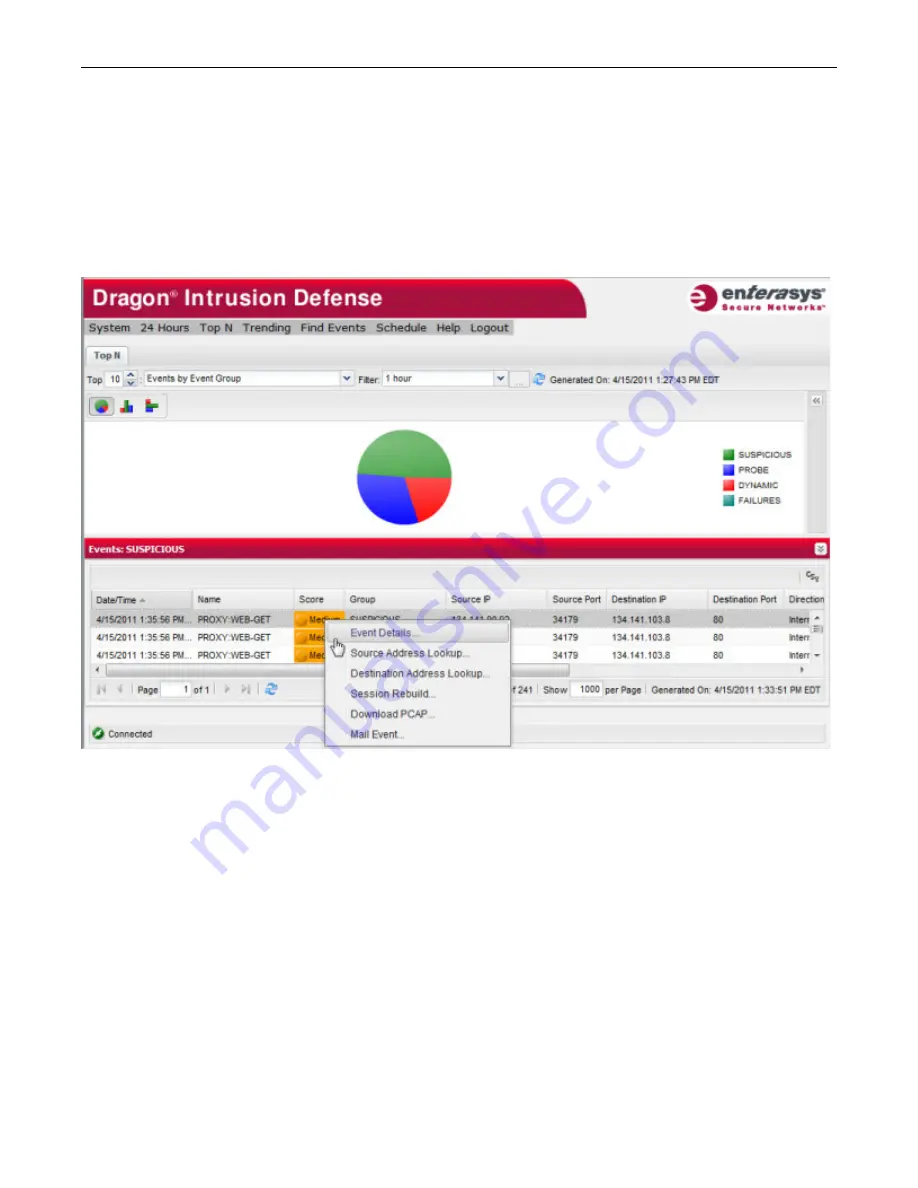
Single clicking on a data group in the chart causes event details to be displayed in the Event Table
pane located at the bottom of the interface window, as shown in the following figure. Right-
clicking on an event in the Event Table pane displays a menu of further actions that can be applied
to the event. For more information about the Event Table pane, see
Chapter 6, Event Table Pane
.
Double clicking on a data group in the chart opens a pane on the right side of the main window
and displays a chart illustrating the event breakdown of the data group. Single clicking on a
section in the right hand chart causes those event details to be displayed in the Event Table pane.
Summary of Contents for Intrusion Prevention System
Page 1: ...P N 9034069 13 Enterasys Intrusion Prevention System Analysis and Reporting Guide...
Page 2: ......
Page 10: ...viii...
Page 60: ...Selecting a Chart Type Top N Reports 4 6 Enterasys IPS Analysis and Reporting Guide...
Page 70: ...Event Growth Report Trending Reports 5 10 Enterasys IPS Analysis and Reporting Guide...
Page 82: ...Viewing a PCAP File for an Event 8 2 Enterasys IPS Analysis and Reporting Guide...


