User guide
ELI
O
S
ECH001XN111-A4 – 07/2022
115
Measurement on ECHOSOFT
6.2 ASSR
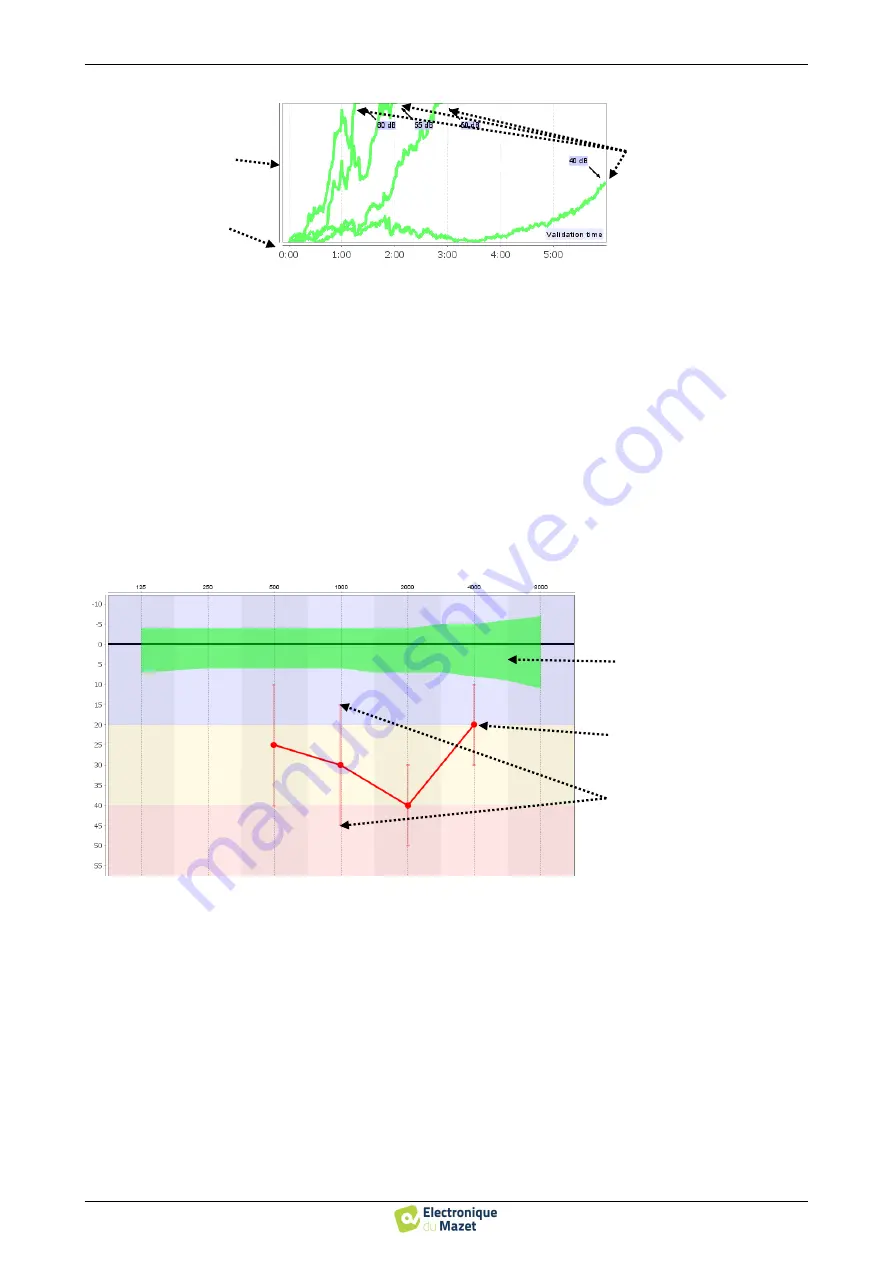
In this example, we can see that the intensities 60 and 40dB are quickly validated, on the other hand, at 20dB the
validation took practically 10 minutes. Finally, for 10dB the measurement was still not validated after 10 minutes, there-
fore it stopped (the maximum time is adjustable during the measurement between 5 minutes and 15 minutes).
The two graphs present a consistency, where, for 60 and 40dB, the ratio between signal and noise is high, which
explains the rapid validation. On the other hand, for 20dB, this ratio is tenuous hence a longer validation and finally, for
10dB no signal emerged from the noise, the system was not able to validate.
The validation system is based on a statistical analysis (MSC / "Magnitude-Squared Coherence" a = 0.05) of the
signal and phase evolution (at the modulation frequency) as well as of the surrounding noise level.
6.2.4.2
Estimated audiometry threshold
Thanks to the presence or absence of a response at the different intensities and at the different frequencies, it is
possible to deduce a hearing threshold. This threshold is not directly coming from the validation values, it is extrapolated
according to the results of various scientific studies which have made the correspondence between the raw
ASSR
thresh-
old and the true audiometry threshold over large cohorts of patients.
As these results are not standardized, they are not to be used as a true audiometry threshold, but as an approximation.
Validation level
(from 0 to 100%)
Time in minutes
Progress of the validation
through time for each inten-
sity
Hearing normality area ac-
cording to patient’s age
Estimated audiometry
threasholh
Threshold estimation area for
each frequency


