Instruction manual CCS 5, 15/ 10/ 2021
21
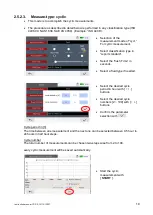
2.5.3.1.
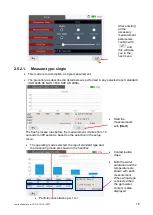
Display the saved results in graphic
•
Select the measuring type
by clicking the tabs “single”
or
“continuous” or “cyclic”
The selected menu tab
is highlighted
“white”.
•
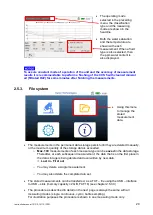
While a USB stick is
inserted, the buttons
“transfer to USB” will show
•
The saved files will be
indicated according date
and time.
•
choose a saved
measurement and open
the data set.
•
open the data set.
Transfer files to
USB
Delete selected
files
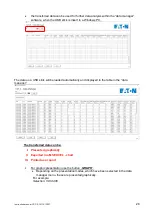
Graphic analysis


