U
S I N G
T H E
S
O F T W A R E
Using the Plot Window
73
▲
Open Template
To open a previously saved plot template, choose Open Template from the File
menu. Select the desired plot template in the Open dialog box and choose OK.
▲
Save Template
To save a plot template, choose Save Template from the File menu. Enter the
desired file name and choose OK.
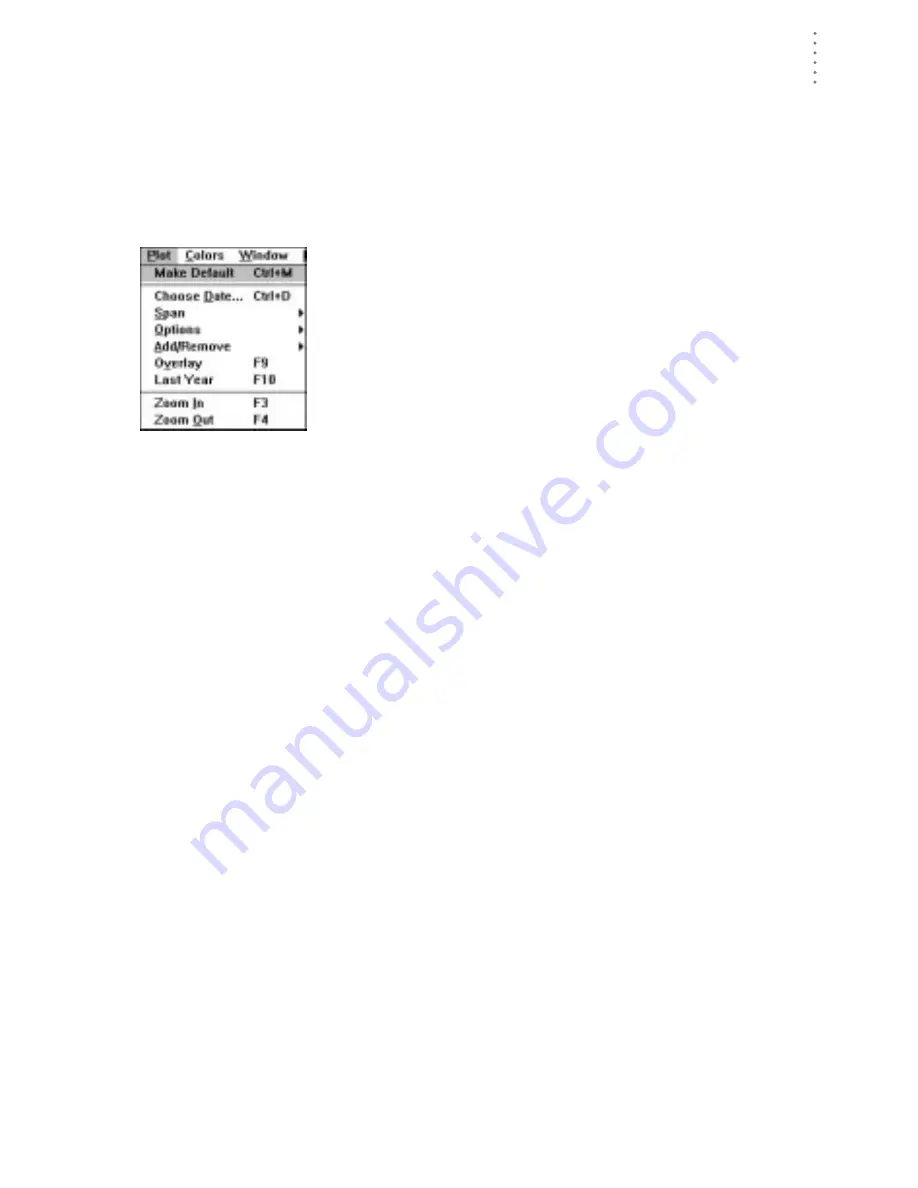
Plot Menu
The commands in the Plot menu allow you to create plots and
set various plot-related options.
▲
Make Default
To make the current plot the default plot (the plot which appears initially
whenever you open the plot window), choose Make Default from the Plot
menu or press Ctrl-M.
▲
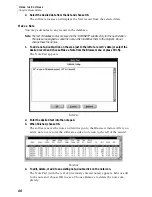
Choose Date
To choose a specific date, choose Choose Date from the Plot menu, click on the
date button in the plot window, or right mouse click anywhere in the plot win-
dow. The Choose Date dialog box appears. Select the desired date from the list
and choose OK.
▲
Span Sub-Menu
To change the plot span of the plot, select the desired plot span from the Span
sub-menu.
▲
Options Sub-Menu
The commands in the Options sub-menu allow you to set a variety of plot
options.
▲
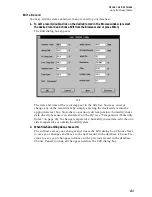
Left/Right/Time Gridlines
You may turn the gridlines on or off for the left axis, right axis, and time
axis separately. When the gridlines are on, a check mark appears beside
the menu command. To change the gridline setting from on to off (or vice
versa) choose the appropriate command from the Options sub-menu.
▲
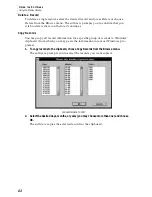
Like Variable Same Scale
Turning this option on facilitates comparison of variables which use the
same unit of measure by forcing the software to use the same scale for any
variables which use the same unit of measure. When this option is on, a
check mark appears beside the menu command. To turn this option on or
off, choose Like Variable Same Scale from the Options sub-menu.
▲
Lock Left/Right Scale
To lock (or unlock) the axis of a plot, choose Lock Scale for the desired axis.

