


U
S I N G
T H E
S
O F T W A R E
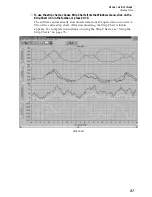
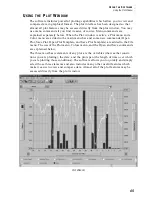
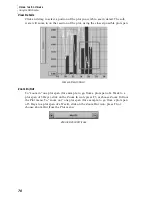
Using the Plot Window
66
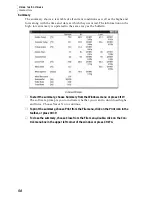
Adding and Removing Variables
▲
Variables Box
The variables box at the bottom of the screen makes it possible to add and
remove variable with a click of the mouse. To add or remove a variable from a
plot, click on the box next to the variable’s name in the variables box. When
you add a variable to the plot, the color of that variable fills the box and the
variable is added to the plot. When you remove a variable, the box becomes
white again and the variable is removed from the plot.
To add or remove multiple variables at one time, hold down the Shift key
while clicking on the desired variables. The program will wait until you
release the Shift key before beginning to draw the plot.
▲
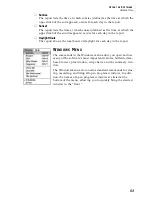
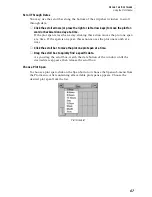
Plot Menu
You may also choose variables from the Add/Remove sub-menu in the Plot
menu to add or remove variables. A variable which is already plotted will
have a check mark before its name in the menu.
▲
Keyboard
If you have only one variable plotted, pressing the up and down arrows
quickly scrolls through the available variables. Watch the variables box or the
axis info button to see what variable is being plotted.
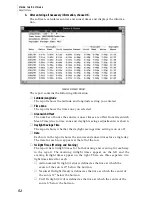
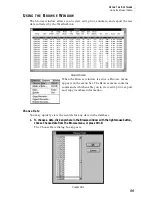
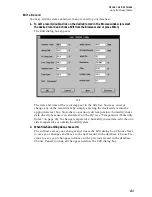
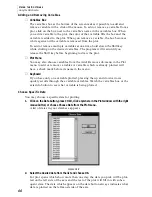
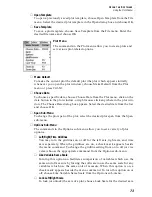
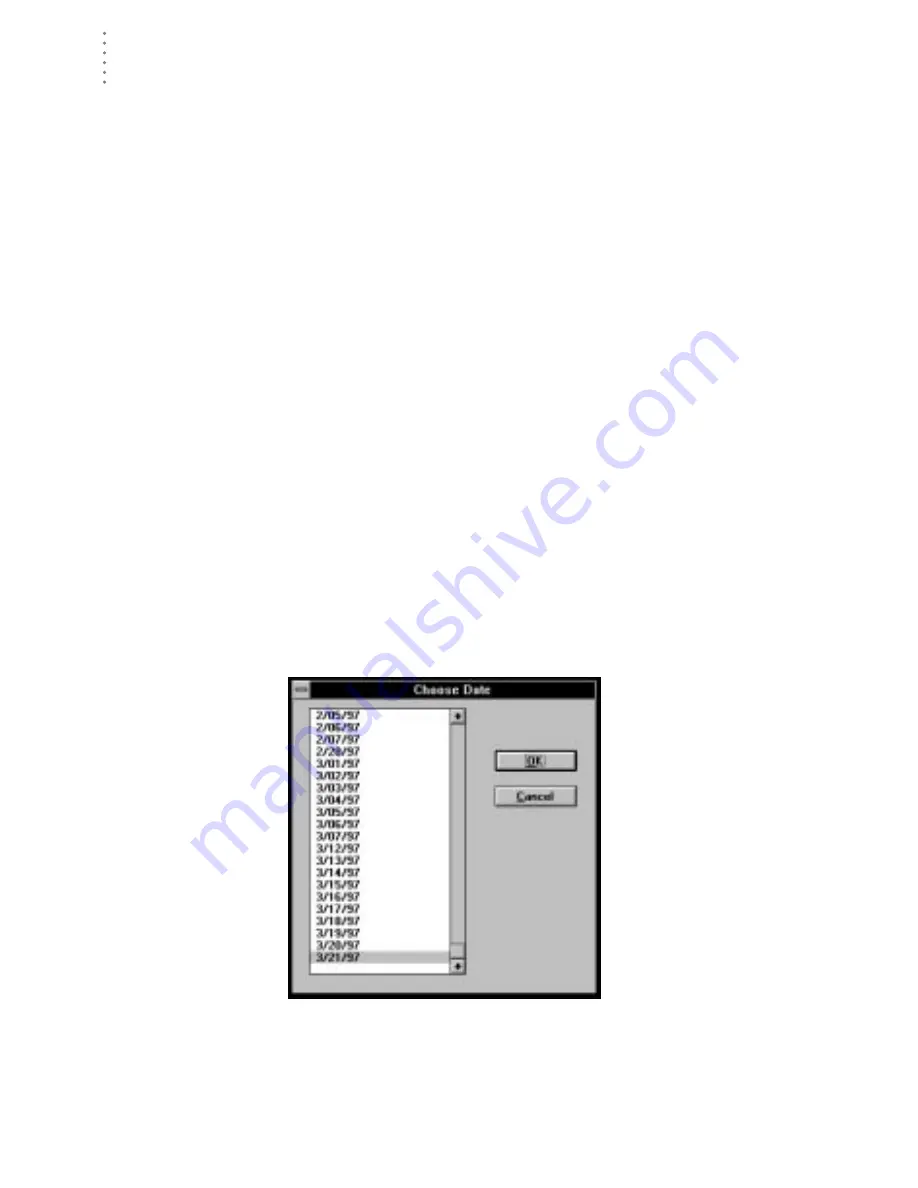
Choose Specific Date
You may choose a specific date for plotting.
1. Click on the Date button, press Ctrl-D, click anywhere in the Plot window with the
right
mouse button, or choose Choose Date from the Plot menu.
A list of dates in your database appears.
C
HOOSE
D
ATE
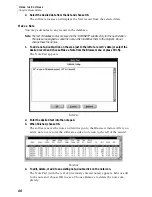
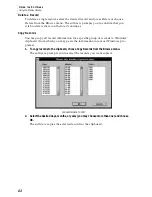
2. Select the desired date from the list and choose OK.
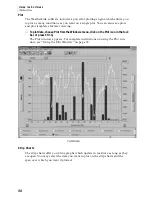
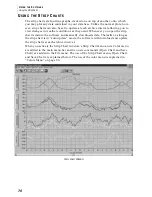
For plot spans which show more than one day, the date you pick will be plot-
ted on the left side of the axis and the rest of the plot will fill in with subse-
quent data. The date which appears on the date button always indicates what
data is plotted on the left-most side of the axis.


