19990401
k
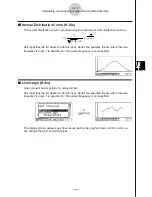
Normal Distribution Curve (N
•
Dis)
The normal distribution curve is graphed using the following normal distribution function.
y
=
1
(2
"
)
x
#
n
e
–
2
x
#
n
2
(
x
–
x
)
2
XList specifies the list where the data is input, while Freq specifies the list where the data
frequency is input. 1 is specified for Freq when frequency is not specified.
k
Line Graph (Brkn)
Lines connect center points of a histogram bar.
XList specifies the list where the data is input, while Freq specifies the list where the data
frequency is input. 1 is specified for Freq when frequency is not specified.
6-2-3
Calculating and Graphing Single-Variable Statistical Data
!
w
(Draw)
The display screen appears as shown above before the graph is drawn. At this point, you
can change the Start and pitch values.
Summary of Contents for ALGEBRA FX 2.0
Page 1: ... ALGEBRA FX 2 0 User s Guide ...
Page 19: ...19990401 ALGEBRA FX 2 0 ...
Page 26: ...19990401 1 1 Keys 1 1 1 Keys REPLAY COPY PASTE CAT CAL H COPY PRGM List Mat i ...
Page 122: ...19990401 ...
Page 280: ...19990401 ...
Page 310: ...19990401 ...
Page 358: ...19990401 8 8 2 Program Library egcw w ww w ...
Page 360: ...19990401 8 8 4 Program Library Example 1 Example 2 fw baw bf w fw baw ca w ...
Page 362: ...19990401 8 8 6 Program Library ...
Page 364: ...19990401 8 8 8 Program Library dw fcde wfcde wfcde fcde w daw w ...
Page 366: ...19990401 8 8 10 Program Library b awaw bwaw aw9d w ...
Page 423: ...19981001 MEMO ...
Page 424: ...19981001 MEMO ...
Page 425: ...19981001 MEMO ...


