


CT-BOX Viewer – Quick Start Guide
11
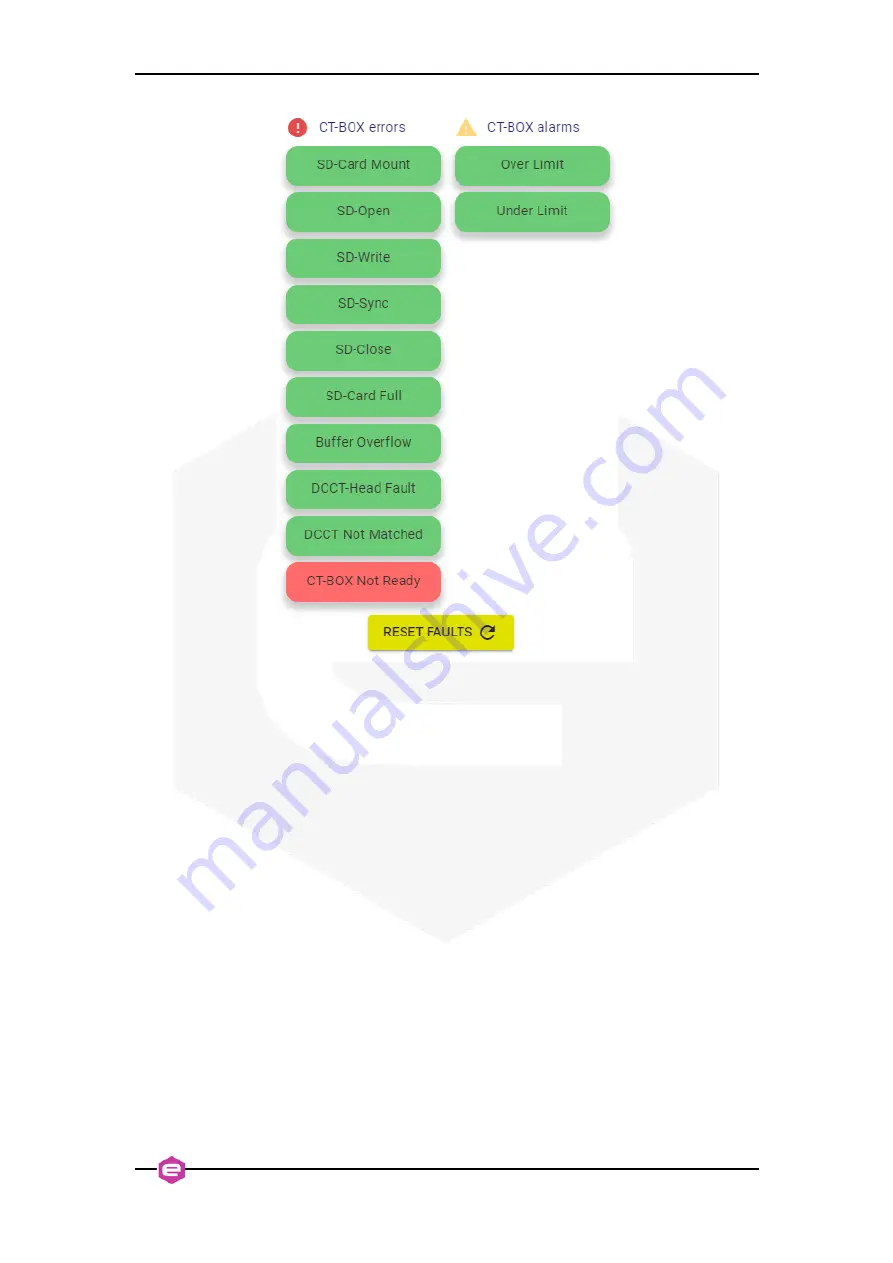
Figure 9:
Errors and Alarms that can occur during the CT-BOX operation.
2.3
CT-BOX Viewer Main Window
Once at least one unit has been added and configured, from the Viewer Main Window
(see
) the user has to select either Data-Logger or Oscilloscope viewer mode
ensuring that it agrees with the one selected in the
ACQUSITION
tab in the
Settings
menu (
Sec. 2.2.1
2.3.1
Data-Logger Mode
When the CT-BOX unit is connected and configured as Data-Logger mode, the plotter
on the Viewer Main Window shows the acquired current (referred to the left y-axis)
and the temperatures (referred to the right y-axis) depending on the previous
configuration. As already mentioned in
Sec. 2.1
, by clicking on the right hamburger
icon, a column panel on the right
opens: the user can easily set both the
current limits
(upper yellow box) and
temperature limits
(lower red box) used in the plot or use the
). To quickly apply the auto-scale function, double-
click on the plotter (alternatively use the horizontal stripe menu,
); to come
back to the previous view, double-click again on the plotter.


