CHAPTER 6. F(T) PLOT
23
6.2 Screen Setup
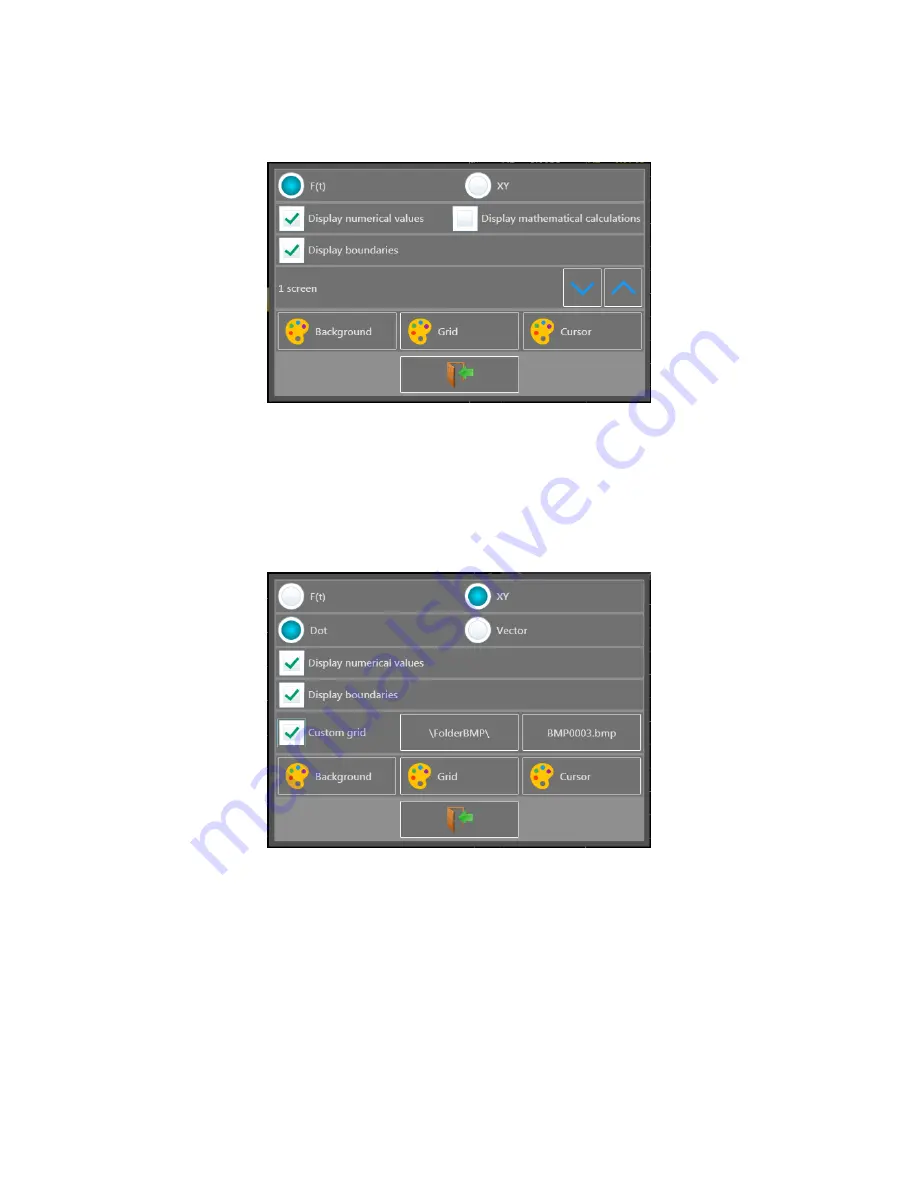
Figure 6.2: Screen Setup Dialog
From this dialog, the type of plot, numerical values, math, grid scales, number of plots, and colors are set here.
The number of plots is available when in F(t) mode, and is limited to the number of signals measured. The
maximum number is 10. When in XY mode, the number of plots is replaced by the option to enable a custom
grid (background image). When a custom grid is enabled, the options of directory and file are added to the
dialog as in Figure
. Lastly, the choice of displaying points as dots or vectors is available for the XY display
mode.
Figure 6.3: Screen Setup Dialog - XY mode
6.2.1 Custom Pages
Using this menu, a set of 20 channels per page can be shown. This allows selecting from different banks of
channels. For example, this allows channels 1 and 101 to be shown on the screen. This is not possible on the
normal display pages.


