BARTINGTON INSTRUMENTS
DCN1040
Page 35 of 39 OM3100/2
8.3.4. Running a Scan
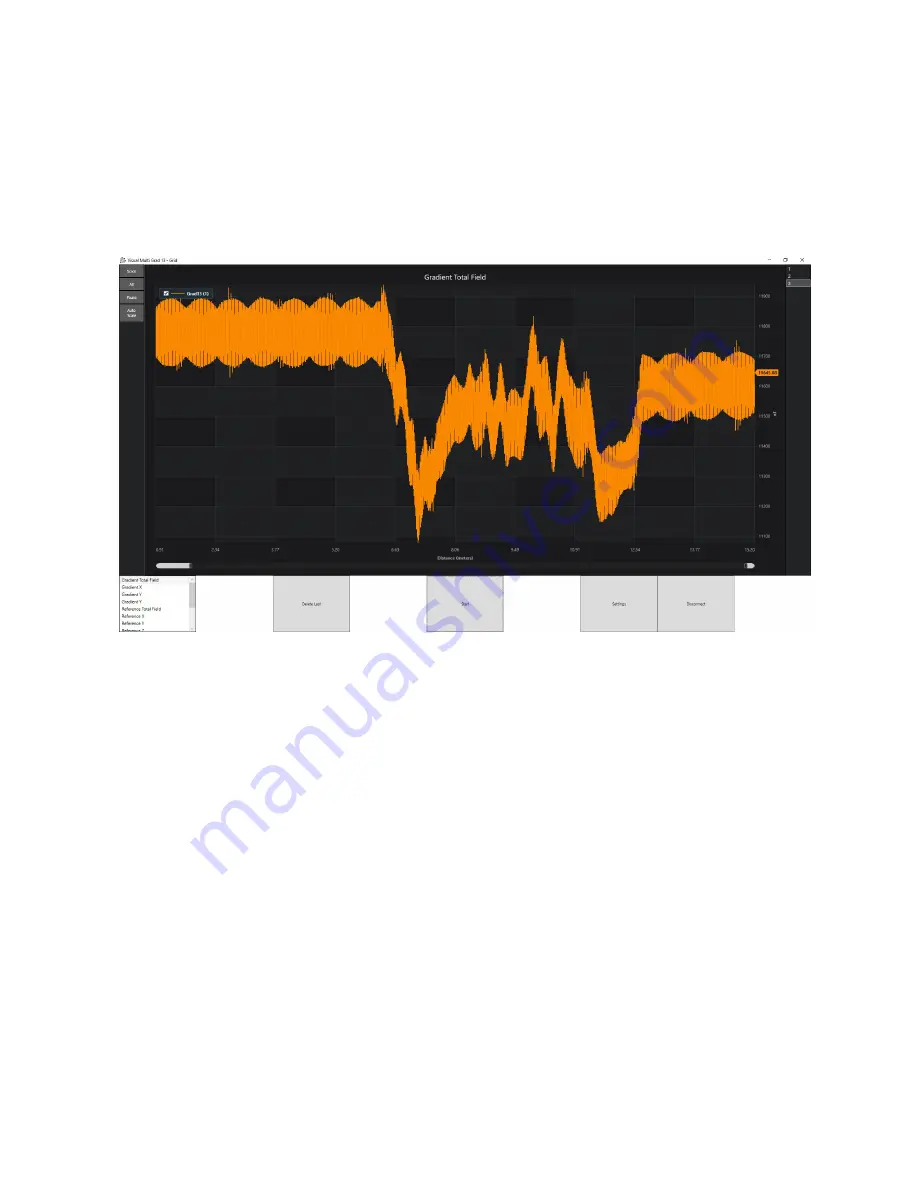
To begin the scan, press ‘Start’. As soon as this button is pressed the software will begin
recording the data being received by each connected Grad-13 and will display it on the graph.
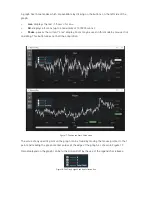
See figure 33 below for an example acquisition using a single Grad-13.
Figure 33: Example Scan
Data will be displayed from each Grad-13 in the corresponding colour given in the key in the
top left. At any point during the scan the acquisition can be stopped using the ‘Stop’ button. The
scan will stop automatically at the end of each traverse based on values entered for grid size and
walking speed. Once stopped, the Grad-13 array can be repositioned before pressing start for the
next traverse.
The current number of lines walked is listed in the top right hand corner of the screen. Each
number represents one traverse, with all gradiometers connected being included. Each
gradiometer is not represented here, rather the system as a whole. Using the ‘Delete Line’
button will go back a traverse, i.e. it will delete the data from the previous traverse for all
Grad13s connected.
Data is saved automatically as it is recorded, and is output to the following file location by
default: C:\MultiGrad13\Logs. Each grid will be stored in a folder corresponding to the Survey
name. To output the data as a .pct file, the export data function can be selected from the survey
window (fig. 23) once the grid has been finished.
There will be three file types stored for each grid, a Survey file, a Grid file, and a CSV file.


