background image

Banner Engineering Corp. 

Vibration Monitoring Solutions Kit Quick Start Guide 

Page 4 

214301 Rev. C 

2.


Follow the interpreting section of th

Conducting a Site Survey and Interpreting the Results

 technical 

note on bannerengineering.com to determine what your results mean for your application. 

Vibration Node Group Screens 

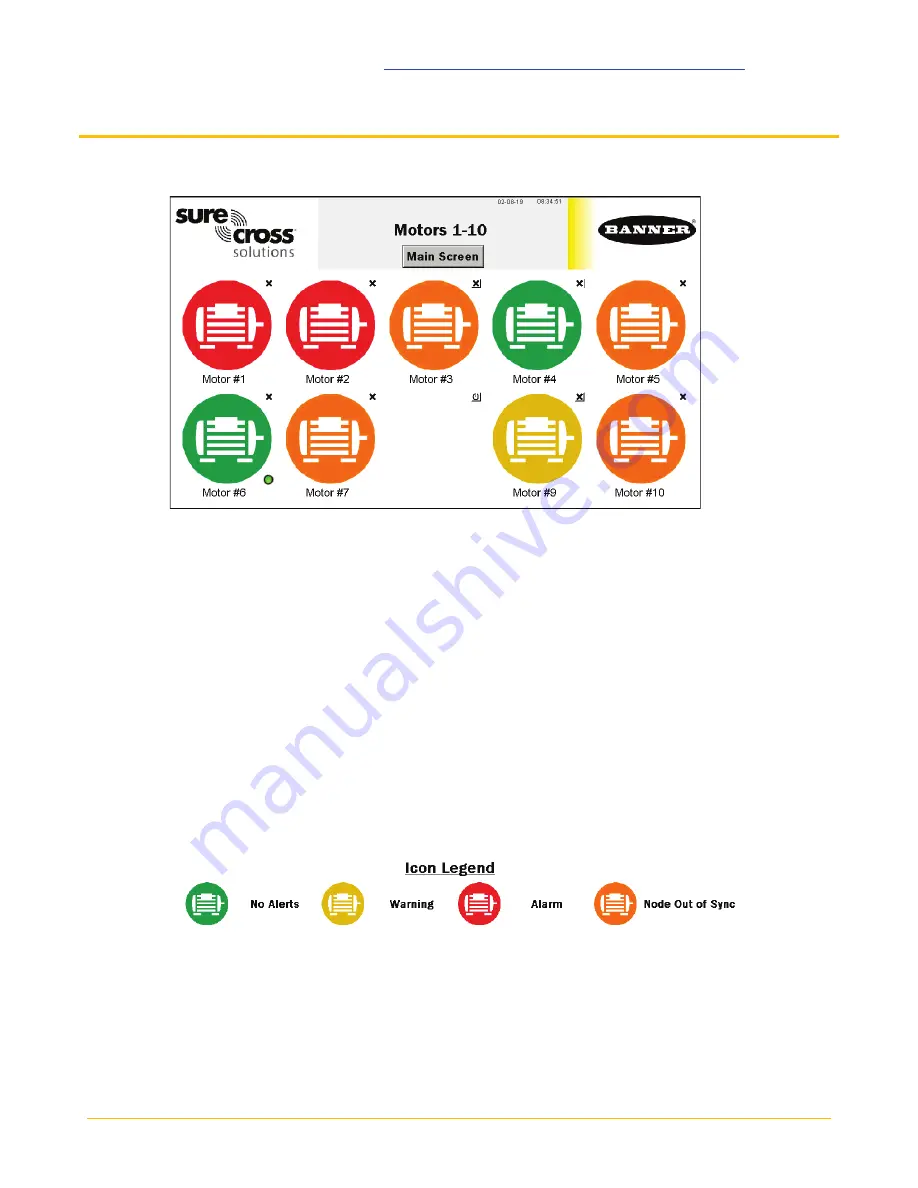
Each sensor group on the main page has a screen of 10 individual icons, one for each vibration sensor. These 
icons represent the status of the motor with colored icons shown below. 

Touch any icon to bring up the individual sensor’s screen that includes graphs, raw data, and alert descriptions. 
(page 5) 

Touch the “X” button in the upper right-hand corner of each icon to hide that sensor and prevent connection 
status alerts from that sensor from appearing on the main HMI screen. Use the button that appears after 
pressing the “X” button to unhide that group for future expansion. For example, Asset #8 is hidden in the sample 
screen. 

Touch each asset label to re-label the icon. That label remains in non-volatile memory and appears on the 
sensor’s status screen, binding screen, site survey screen, and baselining screens. 

A small green lamp in the bottom right corner of a sensor’s icon indicates when that sensor data is baselining. 
Only temperature warnings and alarms appear during the baselining phase. After baselining is complete, the 
threshold levels are established, and vibration alerts may begin to appear. 

If a sensor appears out of sync (orange), that means the radio it is attached to is no longer in sync with the main 
controller. This may indicate you need to replace the battery in the radio or interference is preventing the radio 
from remaining in sync. After replacing the battery or improving the radio’s site survey results, use the network 
reformation button in the Site Survey & Binding (page 3).  


Summary of Contents for MultiHop Series

Page 1: ...igger warnings or alarms Data from assets that are not running operational appear on the graphs but are not used in the analysis RMS Velocity identifies problems such as imbalance misalignment looseness and other low frequency machine issues RMS High Frequency Acceleration is used to indicate early bearing wear issues Solutions Kit Model Radio Frequency Units Contents SolutionsKit9 Vibe MH 900 MHz...

Page 2: ...To use the radio s menu system follow these steps For VT1 sensors use your M H10 radio and for VT2 sensors use one of many radio options such as M H M H2 etc 1 Apply power to the radio and connect one sensor at a time 2 Push button 1 left until DVCFG appears then push button 2 right 3 Push button 1 until S ADR appears and push button 2 4 Push button 1 and wait for the radio to read the current sen...

Page 3: ...button After the radio is bound the LEDs stay solid momentarily then flash four times The radio automatically exits binding mode 4 On the HMI screen touch the binding rocker switch to turn the switch to OFF to take the DXM out of binding mode After the DXM is out of binding mode the indicator LED on the radio flickers green when it is in sync with the DXM 5 Repeat steps 1 through 4 for as many rad...

Page 4: ...on that appears after pressing the X button to unhide that group for future expansion For example Asset 8 is hidden in the sample screen Touch each asset label to re label the icon That label remains in non volatile memory and appears on the sensor s status screen binding screen site survey screen and baselining screens A small green lamp in the bottom right corner of a sensor s icon indicates whe...

Page 5: ...or viewing until those data points have rolled off the end of the timeline Select the data Scale Maximum For Acceleration the range is 0 25g to 5g g force and for Velocity the range is 0 5 inches second to 5 inches second 10 mm s to 60 mm s for metric versions The Current Alerts section shows any warnings or alarms based on the Axis Vibration Characteristic and type Chronic or Acute that the syste...

Page 6: ...very four hours to keep timeouts down to a minimum Baseline Samples The Solutions Kit takes a baseline of the first 300 running samples of an asset This can be adjusted up or down by clicking on this numeric entry box to any desired sample Samples are taken at a fixed five minute interval Acute Alarm Samples The default number of samples above the warning or alarm threshold before an alert is trig...

Page 7: ...ing data without the need to trigger these switches The number of baseline samples remaining displays next to the ON OFF switch The baseline switch remains on during baselining and resets to off after the baseline is complete 2 Use the tabs Assets 1 10 Assets 11 20 Assets 21 30 and Assets 31 40 to access baselining switches for sensors 3 Use the corresponding Manual Warning Alarm Adjustments butto...

Page 8: ...all the raw data baselines and thresholds This data is saved to a file every 30 minutes and a new file is generated every day and stored in monthly folders The HMI has storage for about 45 days of log files Below are some options for managing and retrieving those files Copy Log Files to USB Drive Plug a USB drive into the back of the HMI and click here to select the log files or folders to copy Ma...

Page 9: ...nal registers of vibration information that are stored in the local registers and can be polled by any host connected to the same network or the data can be sent to the cloud Below is a register list of the additional available information Register Number Description 6141 S 10 Z Axis Peak Acceleration 6142 S 10 X Axis Peak Acceleration 6143 S 10 Z Axis Peak Velocity Frequency 6144 S 10 X Axis Peak...

Page 10: ... new static IP address on the new network or to acquire their own IP address via Dynamic Host Configuration Protocol DHCP Connecting to a WAN allows the devices to be configured by any computer on the network and allows the DXM to be configured to push data to a cloud webserver for remote monitoring 1 Open the solution box and connect an ethernet cable from the WAN to the ethernet switch inside th...

Page 11: ...troller to the computer with a USB cable or skip if the DXM is connected to the same network as the computer 6 Select DXM Model as DXM700 and connect the DXM to the tool by clicking Device Connection Settings in the menu bar 7 If you are using the USB cable select Serial then select the COM port that the USB cable is plugged into Click Connect If you are unsure which COM port and multiple appear a...

Page 12: ...the Solutions Kit Follow the steps in the following Tech Note to set up VNC remote viewing and control Tech Note View Solutions Kit Data on a Mobile Device or PC b_4492805 This creates continuity between the site created on the website with the DXM If the DXM has network connection it will upload data on its next cloud push interval Refer to the Banner CDS Web Services Instruction Manual to review...

Page 13: ... equipment does cause harmful interference to radio or television reception which can be determined by turning the equipment off and on the user is encouraged to try to correct the interference by one or more of the following measures Reorient or relocate the receiving antenna Increase the separation between the equipment and receiver Connect the equipment into an outlet on a circuit different fro...

Page 14: ...ncia máxima de antena 10 dBd que en seguida se enlistan También se incluyen aquellas con aprobación ATEX tipo Omnidireccional siempre que no excedan una ganancia máxima de antena de 6dBd El uso con este equipo de antenas no incluidas en esta lista o que tengan una ganancia mayor que 6 dBd en tipo omnidireccional y 10 dBd en tipo Yagi quedan prohibidas La impedancia requerida de la antena es de 50 ...

Reviews: