47 - 60
IsACQ110C-0 (ENG) Rev.230708-0
Temperature Menu
Once the desired plugs have been set, press
“Enter” to return
to the previous menu (Fig. 59).
The
“Confirm”
option is automatically selected.
Pressing
“Enter”
saves the inserted program.
It is also possible to alter the temperature depending on the
time of day. The user can do this by setting the graph.
To set this function, proceed as follows:
Main screen
Main Menu
Temperature
Programs
Insert.
•
Select the temperature reference parameter (
Ref.
) with
keys
, and with keys
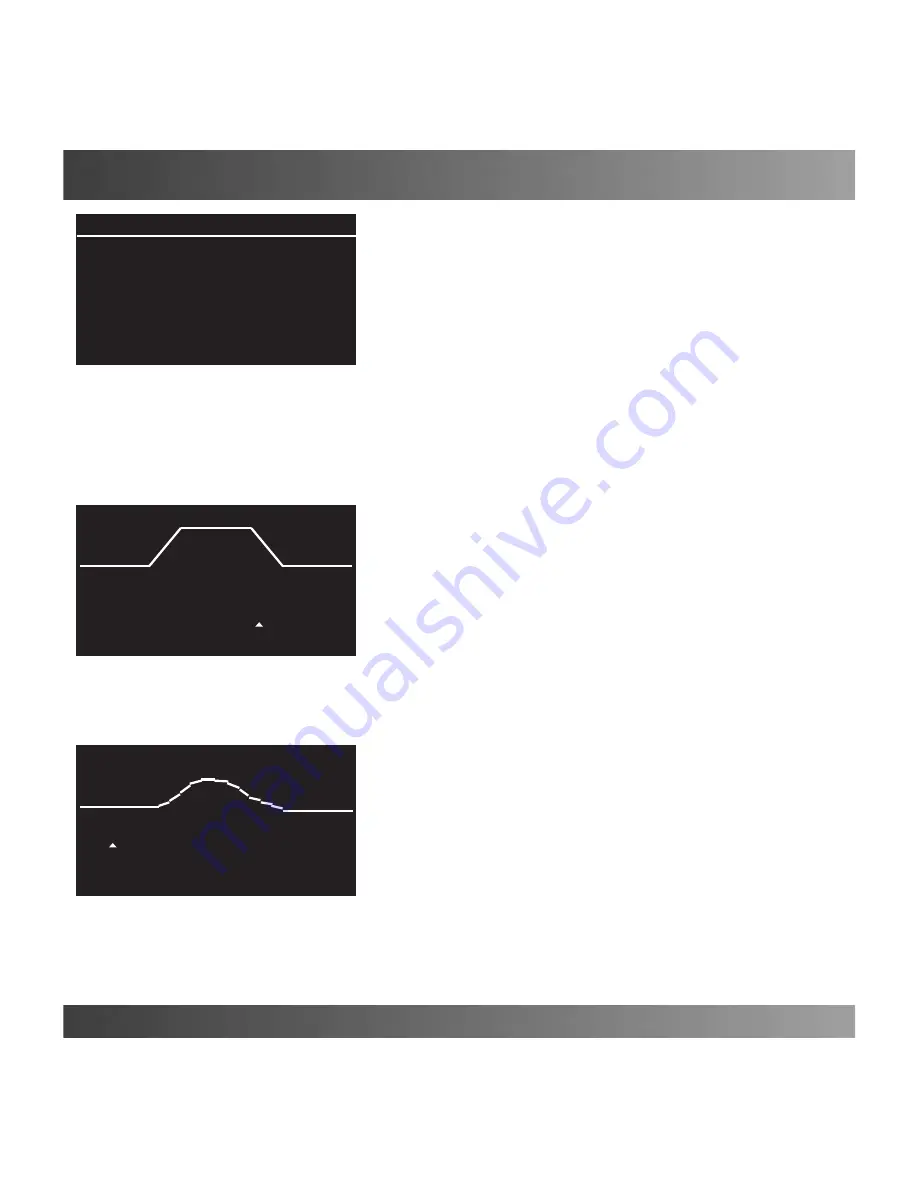
select the “Curve” option
(Fig. 61).
Afterwards, move to the /\/\/\/\ symbol and press
“Enter”.
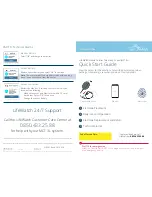
A screen opens where it is possible to graphically model the
desired temperature level in a span of 24 hours (Fig. 62).
•
Select the various hours of the day (in 2 hour intervals,
lower left corner) with keys
and with keys
vary the
temperature (lower right corner) for the selected hour.
Press the “Enter”
key, when completed.
Show/Modify/Delete
See page 31.
Delete All
See page 31.
Data Record
Displays, in a graph, the variations in the temperature of the
previous 24 hours with a minimum interval of 30 minutes.
To display the record, proceed as follows:
Main screen
Main Menu
Temperature
Current Data.
•
Select the maximum (MAX), minimum (MIN) or current
recorded temperature with keys
, and with keys
to
move inside the graph and see the temperature at the desired
time (Fig. 63). When finished, press
“Enter”.
(Fig. 63)
Current Data
11/06 9:30 26.6°C
(Fig. 62)
18:00 27.0°C
(Fig. 61)
Programs
Curve
/\/\/\/\
∆
MIN:
∆
MAX:
0.3°C 0.5°C
Plugs Confirm


