


Smartlog
- 52 -
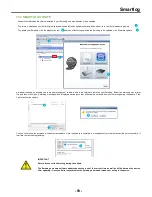
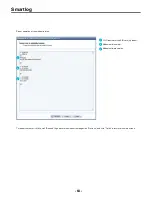
Aquamonitor lets you freely and thoroughly set up the creation and display of graphs. To do this, use the menu dedicated to graphics in the top
banner.
Open the wizard to configure the curves
Print preview
Check the graph in PDF or image format
Regardless of the selected format, a file browser opens to allow you
to choose the name, format (for saving images only) and location to
save the file to.
Delete the selected data set
Cursor options (Value of a set or sets)
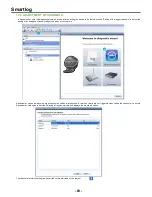
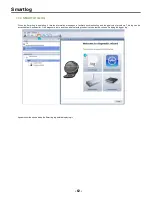
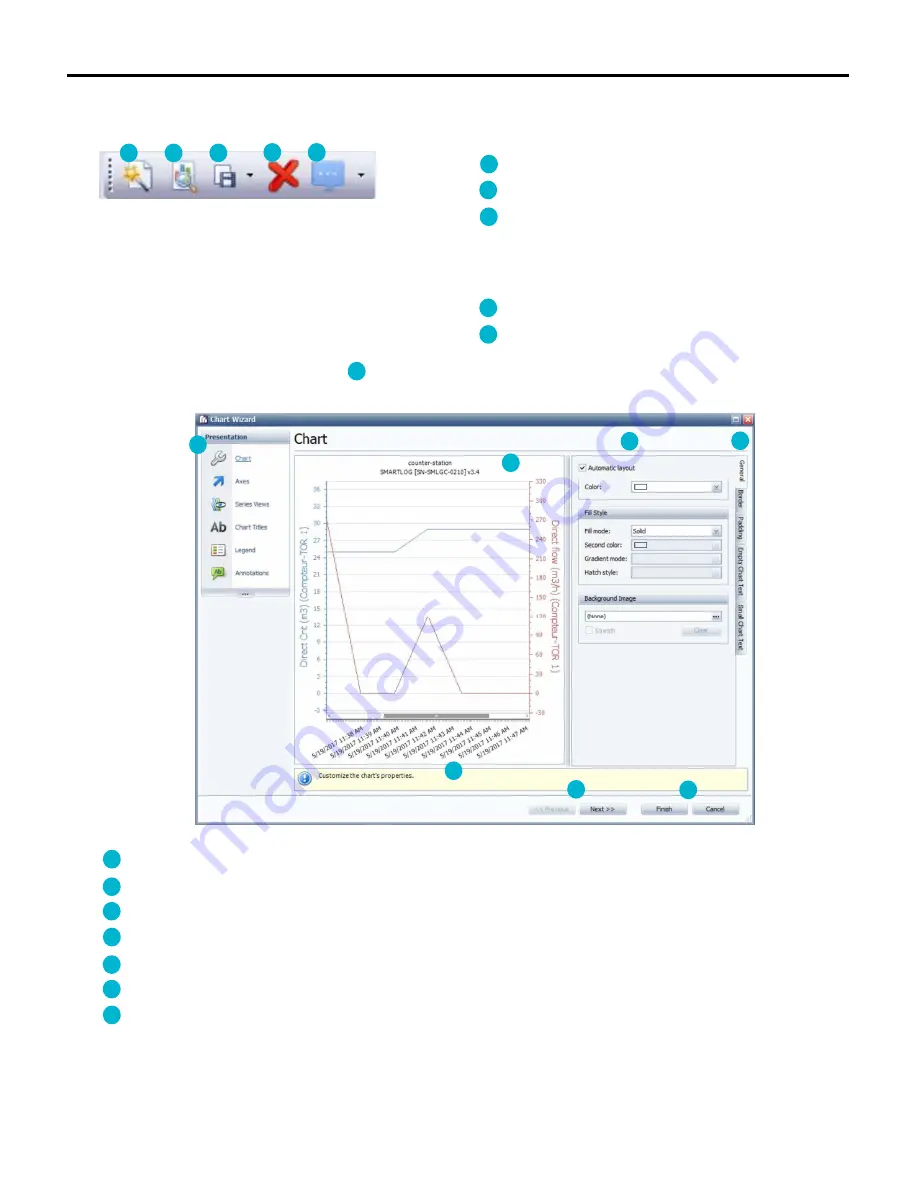
Click on the curve configuration wizard button to start the wizard. The wizard window opens and allows you to fully configure the display of
curves.
: Main sections of the wizard (Graph, Axes, Views of sets, Titles, Keys, and Notes)
: Section configuration tabs
: Adjustable settings in the selected tab
: Results preview window
: Information message on the selected section
: “Previous” / “Next” allows you to browse from one section to another
: Click “Confirm” to apply the changes and close the wizard or click “Cancel” to delete the changes
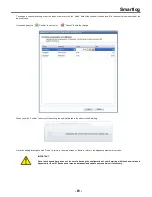
You can also view the selected data sets as a table. To do this, click “Table”. Aquamonitor displays the data sets as a points table.
11
12
13
14
15
11
16
17
18
19
20
21
22
11
12
13
14
15
16
17
18
19
20
21
22
Summary of Contents for SMARTLOG
Page 1: ...SMARTLOG User manual Version 1 0 ...
Page 2: ...Smartlog 2 ...