27
© Airflow • We reserve the right to make changes without prior notice
DV50 DV80
(Integral CO
2
Sensor)
USING THE UNIT
TEMPERATURES AND SENSORS
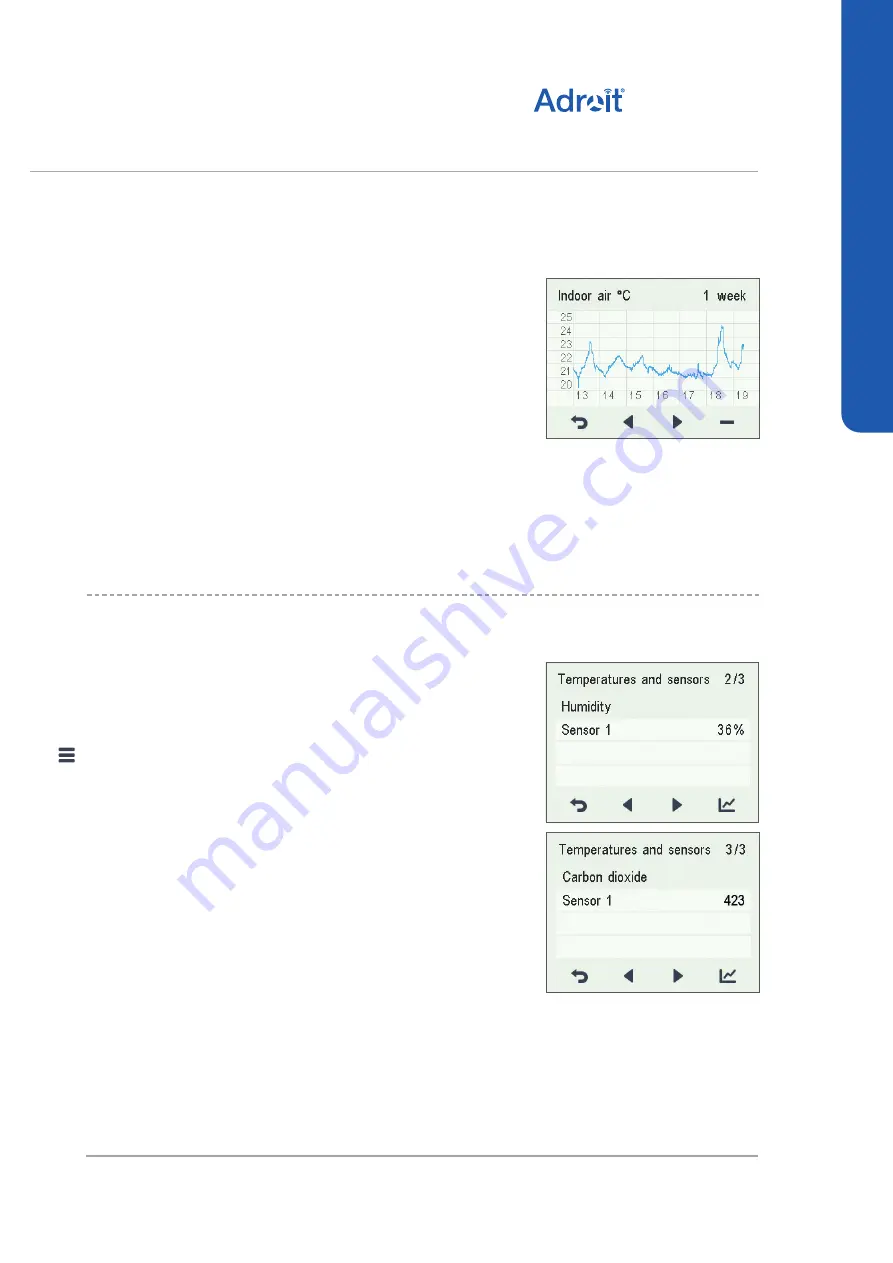
1. A graph is opened, describing the supply air temperature over
the last 24 hours.
2. If you want to view weekly statistics, press the
Plus
button.
3. A graph is opened, describing the supply air temperature over
the last seven days.
4. You can return to daily statistics by pressing the
Minus
button.
5. You can return to the temperature type selection by pressing
the
Back
button.
6. Press the
Right arrow
button.
7. A graph is opened, describing the waste air temperature over
the last 24 hours.
8. If you want to view weekly statistics, press the
Plus
button.
9. A graph is opened, describing the waste air temperature over
the last seven days.
10. You can return to daily statistics by pressing the
Minus
button.
11. You can return to the temperature type selection by pressing
the
Back
button.
12. To exit the menu, press the
Back
button.
VIEWING HUMIDITY AND CARBON DIOXIDE
VALUES
When you want to view individual humidity and carbon dioxide
sensor data, proceed as follows:
1. Select
Settings
>
Temperatures and sensors.
2. Press the
OK
button.
3. The temperature and sensors summary screen is opened.
4. Press the
Right arrow
button.
5. A screen displaying the maximum humidity value from the air
humidity sensors is opened. The value refers to the relative
humidity of the air.
6. Press the
Right arrow
button.
7. A screen displaying the maximum humidity value from the air
humidity extract air sensor is opened, again.
8. Press the
Right arrow
button.
9. A screen displaying the maximum carbon dioxide value from
the air carbon dioxide extract air sensor is opened.
10. Press the
Right arrow
button.
11. A screen displaying the maximum carbon dioxide value from
the air carbon dioxide extract air sensor is opened, again
12. To exit the menu, press the
Back
button.


